Stock market is a "fully-fledged epic bubble" and will burst
Discussion


birdcage said:
So here's a question.
You have 150k cash sitting in your account which you intend to whack into the S&P.
You are already invested and haven't tried to be smart, it's bonus money from the sale of a house or some such.
Reading everything you can about the short/long term direction of the S&P you feel that there is still room for it to fall, possibly 15/20% and you certainly don't think its going to leap up with any sustainability in the next 6 month surely rather than timing the market you are being prudent.
I know it's losing 10% to inflation but only over a six month period not forever and its psychologically less damaging to see it stay in cash than being depleted in swings of 3% a day.
Don't forget on S&P 500 on Vanguard the dividend yield is 1.5% so reducing losses to inflation.You have 150k cash sitting in your account which you intend to whack into the S&P.
You are already invested and haven't tried to be smart, it's bonus money from the sale of a house or some such.
Reading everything you can about the short/long term direction of the S&P you feel that there is still room for it to fall, possibly 15/20% and you certainly don't think its going to leap up with any sustainability in the next 6 month surely rather than timing the market you are being prudent.
I know it's losing 10% to inflation but only over a six month period not forever and its psychologically less damaging to see it stay in cash than being depleted in swings of 3% a day.
However if I wasn't already invested I'd got for the PCA method already suggested.
Edited by Zoon on Thursday 30th June 09:37
ATM said:
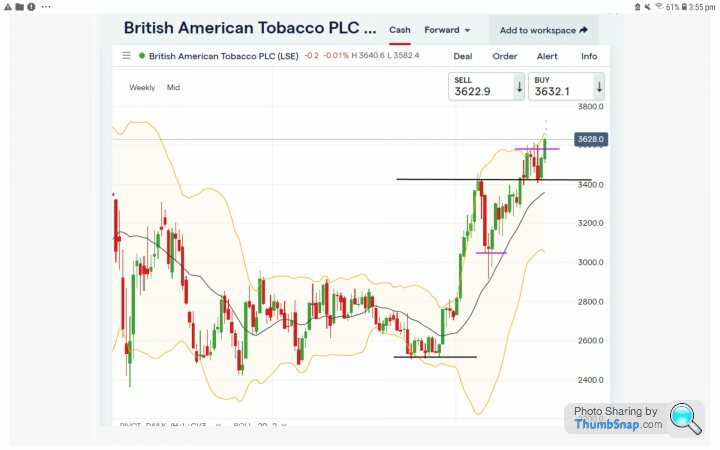
Clear uptrend
Previous High became previous Low just above 3400 - long black line
I added some smaller less obvious high / low in purple but for now you need to focus on the big black line because if price gets below there you have taken out the previous low
Some would argue it needs to close below this line as this is a weekly chart and therefore during a single week it could dip below there and rebound above again and this would not be taking out the low but testing it or rebounding from it depending on what happens next
Thank you ATM.
I might need a translation.
Trying to see what period your chart covers.
It looks like Jan 2020 to present.
Interested whether your charting technique produced a buy signal in March 2020 ?
That of course was when everyone was scared stiff and busy selling, because of the commencement of the pandemic in the UK.
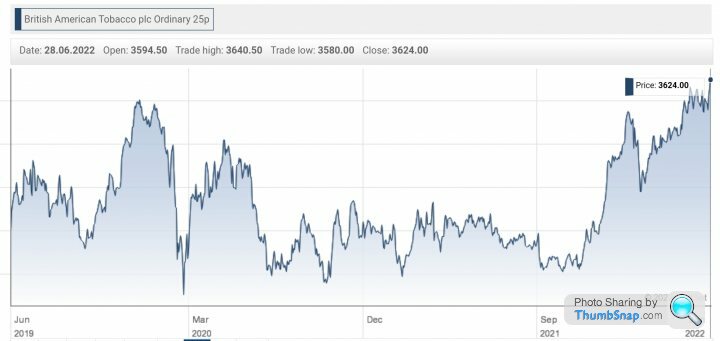
I have had a continuous holding in this company for decades. Tremendous performance.
My buy decisions are only based on business prospects and fundamentals, so summer 2020 was such an obvious opportunity with BAT (low PE, high yield think close to double figures) to buy more at £24 (now £36) (gifted to grandchildren).
Apart from being good value in 2020, the share price increase since then, has been boosted by (unforseen initially) additional buying by investors switching from tech to safety ('economic clouds'). Part of that share price rise has occurred this year (32.7%). There are growth prospects for the business this year (as usual), but I would have thought any further share price increase might risk getting ahead of the fundamentals. The Company guidance (not analyst) for 2022 is for 'revenue growth of 2% to 4% at constant currency and mid-single-figure adjusted diluted earnings per share growth at constant currency'.
I presume charting is used by short-term traders, who want to keep going in and out. Could that technique stand any chance of beating buy at £24 two years ago, then just hold? My lowest buy price was I think, without looking it up, £2-80, but that was a very long time ago.
Two very different strategies, which are interesting to compare. Mine does have one compelling attraction, no ongoing work!
Thanks again and good luck.
( I managed to leave out bmwmike's phrase. _
 )
) Edited by Jon39 on Wednesday 29th June 17:49
Jon39 said:
Sometimes a stock market bubble is clearly obvious (1987, 1999 and 2008 were examples), but in the current circumstances, it might be that it is individual sectors/companies that have become overheated.
a). Identifying a bubble is a lot easier than predicting when it will unwind
b). There was always the chance (which you can never fully discount) that it wasn't actually a bubble because it was "different this time".
Jon39 said:
Digga said:
Jambo85 said:
But there’s basically the same red bar in about March 2021?
My thought and observation too.Yes, that does stand out.
Believers in Chartism probably have an explanation or technical words, for that March 2021 (is it a?) sell indicator.
A false negative perhaps, after looking back 2 years.
The only true way of telling whether charts can forecast the future, are actual portfolio performance results, following the use of charts for decision making.
As a way of selling advisor expertise to potential clients though, perhaps an impressive example of possessing special knowledge.
birdcage said:
So here's a question.
You have 150k cash sitting in your account which you intend to whack into the S&P.
You are already invested and haven't tried to be smart, it's bonus money from the sale of a house or some such.
Reading everything you can about the short/long term direction of the S&P you feel that there is still room for it to fall, possibly 15/20% and you certainly don't think its going to leap up with any sustainability in the next 6 month surely rather than timing the market you are being prudent.
I know it's losing 10% to inflation but only over a six month period not forever and its psychologically less damaging to see it stay in cash than being depleted in swings of 3% a day.
You've skipped over asset allocation to implementation.You have 150k cash sitting in your account which you intend to whack into the S&P.
You are already invested and haven't tried to be smart, it's bonus money from the sale of a house or some such.
Reading everything you can about the short/long term direction of the S&P you feel that there is still room for it to fall, possibly 15/20% and you certainly don't think its going to leap up with any sustainability in the next 6 month surely rather than timing the market you are being prudent.
I know it's losing 10% to inflation but only over a six month period not forever and its psychologically less damaging to see it stay in cash than being depleted in swings of 3% a day.
ATM said:
Some would argue it needs to close below this line as this is a weekly chart and therefore during a single week it could dip below there and rebound above again and this would not be taking out the low but testing it or rebounding from it depending on what happens next
Who are these people?Derek Chevalier said:
There was always the chance (which you can never fully discount) that it wasn't actually a bubble because it was "different this time".
If the CB had not started fighting inflation then maybe this would have been true. But they did print an enormous amount of currency and something had to break. But we didn't know what would break at the time. Lots of people have been talking about inflation and higher prices for years. But they could have been wrong. Now it seems they were right.Jon39 said:
Interested whether your charting technique produced a buy signal in March 2020 ?
I don't get buy and sell signals. Although arguably you could buy when the trend is up and close longs when it ends. We are not talking about shorting here although I'm only shorting right now.The first high on sp500 after March 2020 was a small congestion zone above 3000 and then followed a little low at 3000. They were around June.
So if you were waiting for an uptrend to form then that would have been it.
ATM said:
Jon39 said:
Interested whether your charting technique produced a buy signal in March 2020 ?
I don't get buy and sell signals. Although arguably you could buy when the trend is up and close longs when it ends. We are not talking about shorting here although I'm only shorting right now.The first high on sp500 after March 2020 was a small congestion zone above 3000 and then followed a little low at 3000. They were around June.
So if you were waiting for an uptrend to form then that would have been it.
Thank you ATM.
My strategy, which has outperformed the market over 34 years, does not depend on highs, congestion zones, or lows of the S&P 500, or indeed any other market index.
At the beginning I looked for (what I hoped would be) good businesses to own for the long-term, Fortunately (and you only find out later) I did select a few good ones. You don't need many though, once compounding gathers pace.
Ref. your point about waiting for an uptrend. I admit that it is impossible for me to forecast the future direction of share prices, so uptrends are of little interest. The opportunities that I pay attention to, are low company valuations to buy, usually to increase existing holdings. If you know you are already holding a good business, why put additional money into (what might turn out to be) a less good business?
When you have held businesses long-term and got to know them well, it is easier to spot when a low share price valuation occurs. It probably will not happen very often, but grab it and go in big when it does. Stock market crashes are woth paying attention to, when panic selling is taking place. Whether a subsequent share price increase occurs soon after purchase is not important, because if the company earnings increase, eventually the share price will follow upwards. After my additional BAT purchase in the summer of 2020, a huge share price increase did occur reasonably soon (about 12 months), but that early sudden and significant rerating could not have been foreseen, it was pure luck.
I am sorry ATM, you have not convinced me that Charting will be of any use to me, but if it makes money for you, then that is what investment is supposed to be about.
I see there are some fun terms used by chartists;
Wedge - (sounds Cockney)
Double bottom
Rounded bottom - (no comment)
Double top - (darts)
Head & Shoulders (don't say it)
Flag
Pennant - (similar to a flag, but involves water)
Descending triangle
Follow through
Golden cross
Exhaustion gaps - (coping with a stock market crash?)
Death cross - (receivership?)
Edited by Jon39 on Thursday 30th June 07:54
Derek Chevalier said:
Mr Whippy said:
The recent highs were the largest anomaly on record vs long term averages.
On a global basis or just U.S. based large-cap growth stocks?Is your point that you’re ok to hold exUSA global funds?
Like the global economy is somehow separate to the USA.
USA is tied at the hip to China, and that’s a big issue.
Then EMs will suffer up as USD rises with their rate hikes.
Global recession doesn’t sound good for the E side of PE ratio.
Mr Whippy said:
Derek Chevalier said:
Mr Whippy said:
The recent highs were the largest anomaly on record vs long term averages.
On a global basis or just U.S. based large-cap growth stocks?ATM said:
Mr Whippy said:
Derek Chevalier said:
Mr Whippy said:
The recent highs were the largest anomaly on record vs long term averages.
On a global basis or just U.S. based large-cap growth stocks?I noticed how some posters seemed dismissive of charts, I certainly wouldn't bet the ranch on them but I would say smarter people than me definitely look at them as indicators particularly around short term sentiment, the same as looking at the Options market, it's a good indicator of sentiment. This thread is neither fish nor fowl because a "value" investor who has adopted a view will rigidly hold to the notion that nothing else can work and if it works, it does so only against the overall long term probability. In reality if one is speculating each event , like the spin of a roulette ball, is an event in itself. It might be affected by external circumstances but it might not.
I've done well this week shorting the S+P and Dow but it's not life changing amounts nor is it the big short but again sentiment drives things and when one gets the combined views of serious major players who all think that the US will slow not based on wishes or wants but on common sense, that means if ones risk controls are good, a return can be hard. Never bet against the US as WB says but BK is approx 273USD but was 360USD in late April. This means I'm effectively flat due to my shorts but when BK recovers in the next year, I'll be up.
Without other types of market participants, Value Investors would not really be able to operate as shares would be bought and sold by private placement, there would be no liquidity, in fact Value investors should be glad lots of "schmucks" partake since they must be able to capitalise on the schmucks mistakes but they seem offended by the actions of non strict value investors.
ATM said:
Derek Chevalier said:
There was always the chance (which you can never fully discount) that it wasn't actually a bubble because it was "different this time".
If the CB had not started fighting inflation then maybe this would have been true. But they did print an enormous amount of currency and something had to break. But we didn't know what would break at the time. Lots of people have been talking about inflation and higher prices for years. But they could have been wrong. Now it seems they were right.Mr Whippy said:
Derek Chevalier said:
Mr Whippy said:
The recent highs were the largest anomaly on record vs long term averages.
On a global basis or just U.S. based large-cap growth stocks?Is your point that you’re ok to hold exUSA global funds?
Like the global economy is somehow separate to the USA.
USA is tied at the hip to China, and that’s a big issue.
Then EMs will suffer up as USD rises with their rate hikes.
Global recession doesn’t sound good for the E side of PE ratio.
DaveA8 said:
but I would say smarter people than me definitely look at them as indicators particularly around short term sentiment, the same as looking at the Options market, it's a good indicator of sentiment.
But there are far smarter people out there that with automated processes - I'm not clear how the human loking at a chart can compete (but always open to seeing some evidence).DaveA8 said:
because a "value" investor who has adopted a view will rigidly hold to the notion that nothing else can work and if it works, it does so only against the overall long term probability
I don't know of many value investors that hold a rigid view - most are constantly questioning and are driven by the evidence/dataDaveA8 said:
In fact Value investors should be glad lots of "schmucks" partake since they must be able to capitalise on the schmucks mistakes but they seem offended by the actions of non strict value investors.
Who is offended?Derek Chevalier said:
DaveA8 said:
but I would say smarter people than me definitely look at them as indicators particularly around short term sentiment, the same as looking at the Options market, it's a good indicator of sentiment.
But there are far smarter people out there that with automated processes - I'm not clear how the human loking at a chart can compete (but always open to seeing some evidence).DaveA8 said:
because a "value" investor who has adopted a view will rigidly hold to the notion that nothing else can work and if it works, it does so only against the overall long term probability
I don't know of many value investors that hold a rigid view - most are constantly questioning and are driven by the evidence/dataDaveA8 said:
In fact Value investors should be glad lots of "schmucks" partake since they must be able to capitalise on the schmucks mistakes but they seem offended by the actions of non strict value investors.
Who is offended?DaveA8 said:
Derek Chevalier said:
DaveA8 said:
but I would say smarter people than me definitely look at them as indicators particularly around short term sentiment, the same as looking at the Options market, it's a good indicator of sentiment.
But there are far smarter people out there that with automated processes - I'm not clear how the human loking at a chart can compete (but always open to seeing some evidence).DaveA8 said:
because a "value" investor who has adopted a view will rigidly hold to the notion that nothing else can work and if it works, it does so only against the overall long term probability
I don't know of many value investors that hold a rigid view - most are constantly questioning and are driven by the evidence/dataDaveA8 said:
In fact Value investors should be glad lots of "schmucks" partake since they must be able to capitalise on the schmucks mistakes but they seem offended by the actions of non strict value investors.
Who is offended?), always interested in all viewpoints, especially those that are backed by evidence.Gassing Station | Finance | Top of Page | What's New | My Stuff