Diet and exercise. A graphical view
Discussion


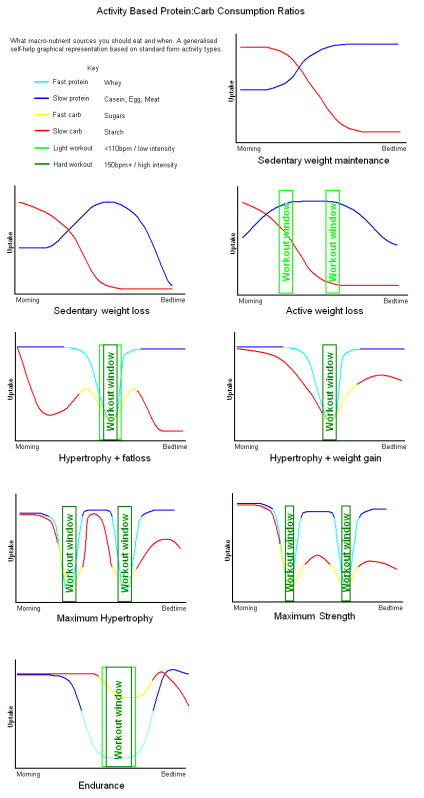
In an effort to make things easier for people to follow, I've been putting diets and exercise into one graphical form, based on standards and guidelines from WHO and ACSM.
You'll notice there is no mention of fat in these graphs. The intent is fat is not a concern (it's a distraction!). If you eat good protein and carb sources you'll get all the fats you need, but this is about basic ratios of what you put in your stomach throughout the day.
So as this is a bit of a WIP I'm looking for constructive feedback from those who have no idea about how to marry diet and exercise or those who already know and think the graphs should be adjusted for more accuracy (or are flat wrong!).
edit: rse. Doesn't compress too well. Here's a higher res version: http://img.photobucket.com/albums/1003/welformed/M...
They show how much protein and carbs you should eat during a day based on your exercise type, if any. These are based on ACSM recommendations.
So it's about WHAT you eat, WHEN you eat it, depending on your objective.
I add the exercise window (for when you intend to exercise), because that determines WHEN you eat. Then I decided to add when you should be eating quickly digested carbs (yellow) and protein (cyan) as this is also an important distinction in WHAT and WHEN you eat.
E.g. the "no carbs before bed" mantra for weight loss is show by a red line that bottoms out toward the right of many of the graphs. The protein line is frequently high, so this means you can eat protein sources, but leave the carbs alone.
mattikake said:
I guess this is still too complicated or is of no interest then?
I love your attitude here, assuming that your graphs are wonderful and too complicated for the lesser people on the forum.I don't want to sound harsh, but my assesment...
I had a look at these the day you put them up and really, they show nothing of any value. All the numbers are arbitary as there is no values on the x or y axis. The nature of the graph would say that you should be constantly eating, all of the time gradulally inceasing and decreasing different nutrient values. TBH, looking at the graphs you've wasted a lot of time IMO because even if the graphs did have relevance to one person, it could be completely different to the next. ACSM guidelines are just that, guidelines, and trying to put them into graphs really really doesn't work.
pilchardthecat said:
The graph seems to be suggesting that for (eg) maximum hypertrophy, a person should be doing two high intensity workouts per day?
Yes and fuel for it. So it's like a double graph of the Hypertrophy graph. This represents serious/dedicated/professional bodybuilding.balders118 said:
mattikake said:
I guess this is still too complicated or is of no interest then?
I love your attitude here, assuming that your graphs are wonderful and too complicated for the lesser people on the forum.balders118 said:
I had a look at these the day you put them up and really, they show nothing of any value. All the numbers are arbitary as there is no values on the x or y axis. The nature of the graph would say that you should be constantly eating, all of the time gradulally inceasing and decreasing different nutrient values. TBH, looking at the graphs you've wasted a lot of time IMO because even if the graphs did have relevance to one person, it could be completely different to the next. ACSM guidelines are just that, guidelines, and trying to put them into graphs really really doesn't work.
My intent *is* for the numbers to be arbitrary because actually how much someone would eat would depend on their size, somatotype, weight, etc. as well as the type routine they are doing. so there is no direct value that applies to everyone.I did have meals, but I removed them because some may choose to eat 5 times a day with bigger meals, others 7 times a day with smaller meals. So however many times you choose to eat is up to you, but the protein:carb ratio stays the same. Maybe it's just easier to put meal numbers back in. Essentially with the graphs where the colours change between slow/fast food, that implies a different meal. So for Max Hypertrophy you are looking at eating 7 times a day, but that includes snacks, protein shakes, carb gels etc.
So yeah, they are graphical representations of guidelines. It's naturally going to be general.
This is version 3 btw. I expect there to be more!

Edited by mattikake on Friday 6th July 16:00
mattikake said:
pilchardthecat said:
The graph seems to be suggesting that for (eg) maximum hypertrophy, a person should be doing two high intensity workouts per day?
Yes and fuel for it. So it's like a double graph of the Hypertrophy graph. This represents serious/dedicated/professional bodybuilding.pilchardthecat said:
mattikake said:
pilchardthecat said:
The graph seems to be suggesting that for (eg) maximum hypertrophy, a person should be doing two high intensity workouts per day?
Yes and fuel for it. So it's like a double graph of the Hypertrophy graph. This represents serious/dedicated/professional bodybuilding.I have heard of a lot of bodybuilders do 2 or even 3 workouts a day, even the same muscle group, separated by several hours. But they would probably workout 3-5 days a week or have 1 week off in 4 etc.
The alternative is that the difference of amateur and pro is technique, dedication, pain threshold and diet, but not regularity. In the graphs this would mean there is only Hypertrophy and no Maximum Hypertrophy.
mattikake said:
Not at all. I try to find ways of being efficient with information, but sometimes I'm the only one who can properly understand it. Intelligence is probably a lot to do with it; fat people have no chance.
Edited because... well, it's so fitting!The World According To Matt
Gassing Station | Health Matters | Top of Page | What's New | My Stuff