Anyone good at maths?
Discussion


I've spent the past week or so trying to figure this out (see link)
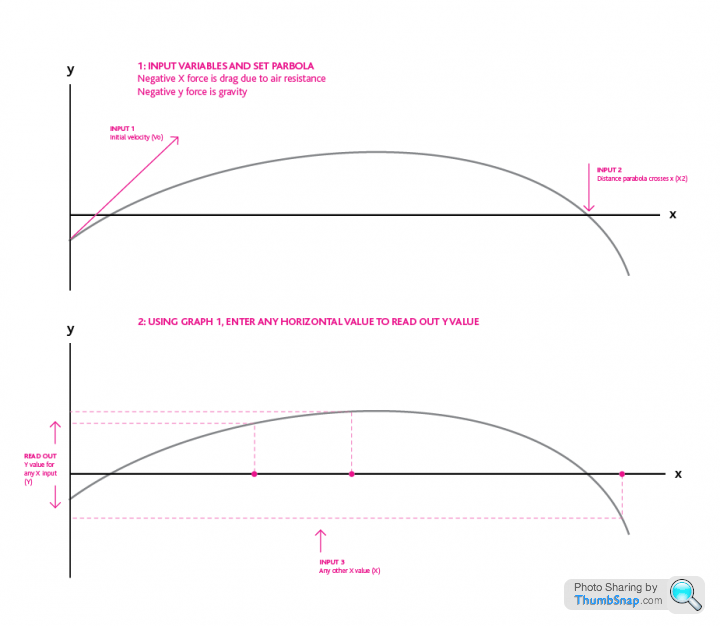
It's a graph that plots the parabola of a projectile, affected by gravity and drag. You'd set this by inputting only two variables: Initial velocity and a landing point.
Once set, I'd like to input x values and read out the y value.
It's proving quite tricky. Anyone have any ideas?
It's not for any commercial gain by the way, just an interesting side project... :-)
thanks
This any use, or are you past this already? http://www.dummies.com/how-to/content/how-to-graph...
Rather than producing some fancy calculus derived polynomial, I would iterate it. Start with a fixed mass, velocity and direction. Resolve the X and Y vectors. Add a fixed gravity (9.81m/s/s) to each iteration of the -Y speed scalar. Subtract drag from each component speed (proportional to the square of the component speed). Update the position for each component from the x&Y speed * time interval. Iterate through it at, say, 1 millisecond intervals until Y<=0 or whatever termination you choose.
Zad said:
Rather than producing some fancy calculus derived polynomial, I would iterate it. Start with a fixed mass, velocity and direction. Resolve the X and Y vectors. Add a fixed gravity (9.81m/s/s) to each iteration of the -Y speed scalar. Subtract drag from each component speed (proportional to the square of the component speed). Update the position for each component from the x&Y speed * time interval. Iterate through it at, say, 1 millisecond intervals until Y<=0 or whatever termination you choose.
I think I understand what you're saying. If so it's a good idea to do ONE graph, but I need the formula so I can run it like a single function calculator for other inputs of Vo and X2. FlavaDave said:
I think I understand what you're saying. If so it's a good idea to do ONE graph, but I need the formula so I can run it like a single function calculator for other inputs of Vo and X2.
Yes. You split (resolve) the polar coordinates (speed and angle) into two separate X and Y parts. You then modify the X and Y parts to take into account gravity and friction. Do this lots of times til it hits the ground, or the X point you are looking for. If you like, you can then convert the final X and Y back into polar (speed and angle) terms.But, as you need a non-iterated version...
Google for trajectory with drag equation. It gets complicated very quickly. Interesting that the NASA K12 (i.e. for small children) goes into calculus.
The height y of the projectile at distance x is given by
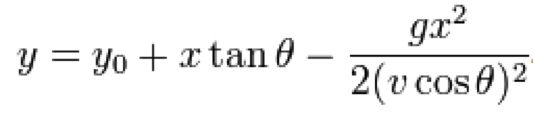
g: the gravitational acceleration—usually taken to be 9.81 m/s2 near the Earth's surface
θ: the angle at which the projectile is launched
v: the velocity at which the projectile is launched
y0: the initial height of the projectile
d: the total horizontal distance traveled by the projectile
Everything you need is in here:
http://en.wikipedia.org/wiki/Trajectory_of_a_proje...
MiseryStreak said:
The height y of the projectile at distance x is given by
g: the gravitational acceleration—usually taken to be 9.81 m/s2 near the Earth's surface
θ: the angle at which the projectile is launched
v: the velocity at which the projectile is launched
y0: the initial height of the projectile
d: the total horizontal distance traveled by the projectile
Everything you need is in here:
http://en.wikipedia.org/wiki/Trajectory_of_a_proje...
If you ignore drag. The more involved maths at the bottom of the Wiki link include drag and shows how much that complicates matters! g: the gravitational acceleration—usually taken to be 9.81 m/s2 near the Earth's surface
θ: the angle at which the projectile is launched
v: the velocity at which the projectile is launched
y0: the initial height of the projectile
d: the total horizontal distance traveled by the projectile
Everything you need is in here:
http://en.wikipedia.org/wiki/Trajectory_of_a_proje...

ewenm said:
MiseryStreak said:
The height y of the projectile at distance x is given by
g: the gravitational acceleration—usually taken to be 9.81 m/s2 near the Earth's surface
θ: the angle at which the projectile is launched
v: the velocity at which the projectile is launched
y0: the initial height of the projectile
d: the total horizontal distance traveled by the projectile
Everything you need is in here:
http://en.wikipedia.org/wiki/Trajectory_of_a_proje...
If you ignore drag. The more involved maths at the bottom of the Wiki link include drag and shows how much that complicates matters! g: the gravitational acceleration—usually taken to be 9.81 m/s2 near the Earth's surface
θ: the angle at which the projectile is launched
v: the velocity at which the projectile is launched
y0: the initial height of the projectile
d: the total horizontal distance traveled by the projectile
Everything you need is in here:
http://en.wikipedia.org/wiki/Trajectory_of_a_proje...
Anyway. We've worked it out over the weekend. Thanks for all your input. :-)
FlavaDave said:
Yes, if you ignore drag AND know the angle of elevation of the muzzle.
Anyway. We've worked it out over the weekend. Thanks for all your input. :-)
I assumed you knew this as you said "You'd set this by inputting only two variables: Initial velocity and a landing point."Anyway. We've worked it out over the weekend. Thanks for all your input. :-)
You must be entering a launch angle to plot the graph?
Gassing Station | Science! | Top of Page | What's New | My Stuff