Climate Change - The Scientific Debate (Vol. II)
Discussion


I'm afraid I still don't really see your point. I can't even tell from the graph you posted if the end bit spliced is Manu Loa or polar data from the ice core location because the difference is too small.
Is there anywhere left where the yearly average is less than 400ppm?
Is there anywhere left where the yearly average is less than 400ppm?
Edited by hairykrishna on Wednesday 4th October 16:06
hairykrishna said:
I'm afraid I still don't really see your point. I can't even tell from the graph you posted if the end bit spliced is Manu Loa or polar data from the ice core location because the difference is too small.
Seriously HK? Given the scale on the bottom how many readings should be from Mauna Loa if we normalise just for temporal element (ignoring for the moment the location difference)?Not many, obviously. Plus there's lot of temporal stuff, different uncertainties in different cores etc etc. Not sure why you're banging on about equator vs pole really.
How about a more recent timescale?
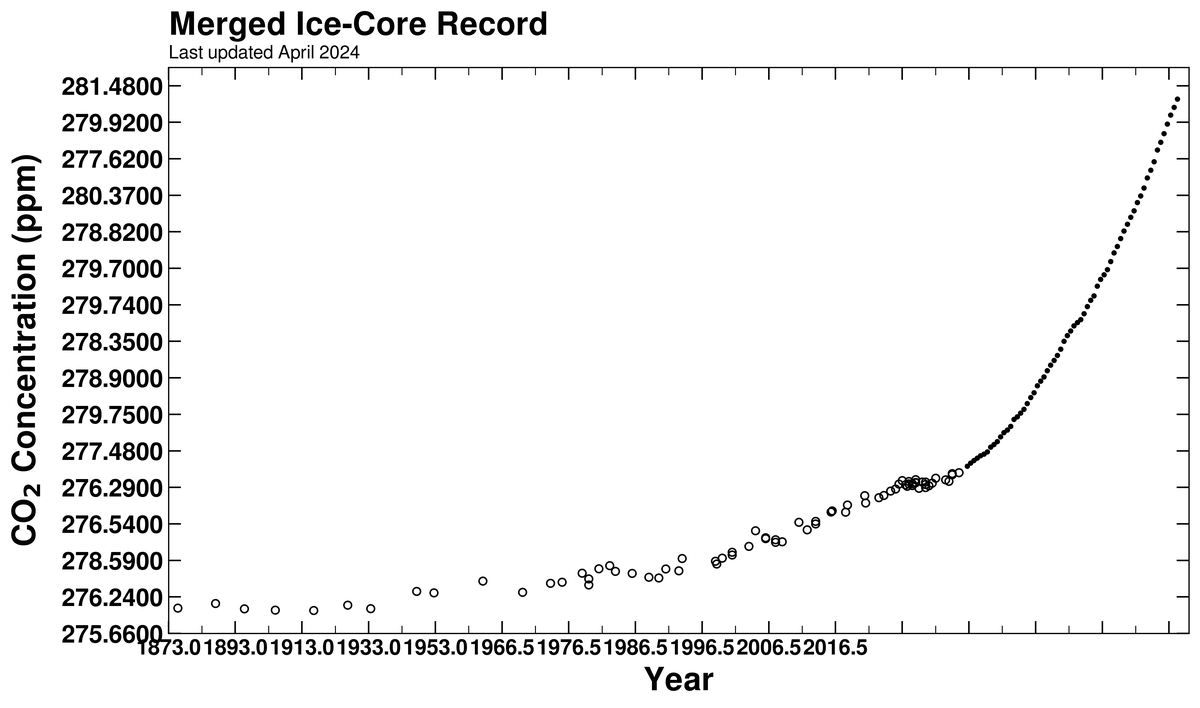
Atmospheric CO2 record based on ice core data before 1958, (Ethridge et. al., 1996; MacFarling Meure et al., 2006) and yearly averages of direct observations from Mauna Loa and the South Pole after and including 1958 (from Scripps CO2 Program).
How about a more recent timescale?
Atmospheric CO2 record based on ice core data before 1958, (Ethridge et. al., 1996; MacFarling Meure et al., 2006) and yearly averages of direct observations from Mauna Loa and the South Pole after and including 1958 (from Scripps CO2 Program).
robinessex said:
budgie smuggler said:
robinessex said:
PS Forget about CO2, it's been higher in the past, and we're still here. And so what if the planet temperature rises by a minuscule amount in 100yrs.Talk about looking for a problem that don’t exist.
Back to this again.Anatomically modern humans have been around roughly 300,000 years. The CO2 level has been between 175 and 300 PPM for that entire period (and in fact much longer before that). Now it is 400+ PPM. So no, in our past it has never been as high as it is now.

So you don't actually care about keeping the planet in the conditions which allow humans (and all currently alive creatures) to exist? As long Earth has had those conditions before at some time, no matter.
budgie smuggler said:
robinessex said:
budgie smuggler said:
robinessex said:
PS Forget about CO2, it's been higher in the past, and we're still here. And so what if the planet temperature rises by a minuscule amount in 100yrs.Talk about looking for a problem that don’t exist.
Back to this again.Anatomically modern humans have been around roughly 300,000 years. The CO2 level has been between 175 and 300 PPM for that entire period (and in fact much longer before that). Now it is 400+ PPM. So no, in our past it has never been as high as it is now.
So you don't actually care about keeping the planet in the conditions which allow humans (and all currently alive creatures) to exist? As long Earth has had those conditions before at some time, no matter.
Jinx said:
kerplunk said:
Ok I'll run with this for a bit.
You said:
[i]20 ppm = 155.5 Gigatonnes of CO2.
Which at 1990's levels equates to about 300 years of UK emissions.[/i]
A quick google reveals a figure for ppm to weight conversion: 1ppm = 7.81 Gigatonnes of Carbon Dioxide.
So we can see where you got your 155.5 figure from.
However it should also be obvious that's a figure for the whole atmophere, and from your map we can see it's only 20ppm less at the poles and ~400ppm just about everywhere else with some regions higher than 400ppm.
So your figures are rubbish, and I still don't see your point.
I'll try again. The 20 ppm that is happily dismissed as not important - i.e. the poles today vary by 20 ppm from the official CO2 at Mauna Loa yet the Mauna Loa data was spliced onto the ice core data to give the CO2 trend for 300,000 years. That 20 ppm is equivalent to the entire emissions of the UK for 300 years (and at 1990 levels for 300 years) . You said:
[i]20 ppm = 155.5 Gigatonnes of CO2.
Which at 1990's levels equates to about 300 years of UK emissions.[/i]
A quick google reveals a figure for ppm to weight conversion: 1ppm = 7.81 Gigatonnes of Carbon Dioxide.
So we can see where you got your 155.5 figure from.
However it should also be obvious that's a figure for the whole atmophere, and from your map we can see it's only 20ppm less at the poles and ~400ppm just about everywhere else with some regions higher than 400ppm.
So your figures are rubbish, and I still don't see your point.
The splice creates a possible error in the chart as great as the entire UK emissions since the industrial revolution and for the next two generations. This is another hockey stick (though less controversial than Mann's Northern hemisphere temperature reconstruction) created by splicing incompatible data of different locations and different time intervals. The figure itself is akin to the "number of hydrogen bombs" analogy but I used it to highlight where what appears to be a "small" tweaking of the data to make a nice chart makes large enough error bars to drive a county through. That is my point.
Looks like you're using incompatible data to say there's a discrepancy due to incompatible data - a bit circular.
Let's try and use compatible data as far as possible then - see the in-situ data already posted that shows only a 2.7ppm difference between Jubey in Antarctica and Mauna Loa.
Here's the in-situ obs from the South Pole Observatory that show CO2 passing the 400ppm mark last June (lagging ML by 18 months):
ftp://aftp.cmdl.noaa.gov/data/trace_gases/co2/in-situ/surface/spo/co2_spo_surface-insitu_1_ccgg_MonthlyData.txt
Where does that satellite chart you're using come from? It's got a Wattsupwiththat url. Can we see a description of it somewhere?
I think you've got a bit more work to do to justify tacking an extra 20ppm on the ice core data.
hairykrishna said:
Looks like OCO data from a few years ago. I think even the low bits are now past 400
Yes it's the first 12 months worth of monthly data from the OCO-2 satellite launched in 2014 all combined into one image by a WUWT contributor (Eric Swensen) on it's release by Nasa.I found it on this 2015 WUWT page here:
https://wattsupwiththat.com/2015/10/04/finally-vis...
Problems emerge in the thread...
Erik Swenson
October 5, 2015 at 4:27 pm
"I discovered an error in my scale map. The actual range is 389 – 406. I am working with Anthony to find the best way to update this page. SOOO many comments!"
2 years later the error remains.
There are other issues too if you can be bothered to wade through the thread.
Clearly it was just a naive first stab at some very new data by someone with little understanding of the product.
NASA in the meantime have published more OCO-2 images and nowhere do you see the high latitudes lagging far behind.
https://oco.jpl.nasa.gov/galleries/gallerydataprod...
kerplunk said:
NASA in the meantime have published more OCO-2 images and nowhere do you see the high latitudes lagging far behind.
https://oco.jpl.nasa.gov/galleries/gallerydataprod...
Did you look at the entire sequence KP? Whilst there are breaks in the data there is definitely a lagging in the northern hemisphere? PS they are in reverse order.https://oco.jpl.nasa.gov/galleries/gallerydataprod...
Edited by Jinx on Thursday 5th October 07:38
Jinx said:
kerplunk said:
NASA in the meantime have published more OCO-2 images and nowhere do you see the high latitudes lagging far behind.
https://oco.jpl.nasa.gov/galleries/gallerydataprod...
Did you look at the entire sequence KP? Whilst there are breaks in the data there is definitely a lagging in the northern hemisphere? PS they are in reverse order.https://oco.jpl.nasa.gov/galleries/gallerydataprod...
Edited by Jinx on Thursday 5th October 07:38
What I'm not seeing is anything that justifies adding 20ppm to the ice core data to line it up with ML. We do see a small lag of a few ppm in antarctica vs ML, but currently CO2 levels are increasing by a few ppm very year - from sources mostly in the northern hemisphere. It's not clear that even that small difference would be there in the past when CO2 levels were in (quasi) equilibrium.
kerplunk said:
I'm seeing seasonal variation. Did you look at the entire sequence?
What I'm not seeing is anything that justifies adding 20ppm to the ice core data to line it up with ML. We do see a small lag of a few ppm in antarctica vs ML, but currently CO2 levels are increasing by a few ppm very year - from sources mostly in the northern hemisphere. It's not clear that even that small difference would be there in the past when CO2 levels were in (quasi) equilibrium.
Look at the maps again - pin point Mauna Loa and Greenland and look through the sequence again.What I'm not seeing is anything that justifies adding 20ppm to the ice core data to line it up with ML. We do see a small lag of a few ppm in antarctica vs ML, but currently CO2 levels are increasing by a few ppm very year - from sources mostly in the northern hemisphere. It's not clear that even that small difference would be there in the past when CO2 levels were in (quasi) equilibrium.
I would never suggest adding 20ppm to the core data to "line up with ML" as they are two distinct data sets measuring over different time scales in different places. Just because NASA does:

Doesn't make it right or science.
Jinx said:
kerplunk said:
I'm seeing seasonal variation. Did you look at the entire sequence?
What I'm not seeing is anything that justifies adding 20ppm to the ice core data to line it up with ML. We do see a small lag of a few ppm in antarctica vs ML, but currently CO2 levels are increasing by a few ppm very year - from sources mostly in the northern hemisphere. It's not clear that even that small difference would be there in the past when CO2 levels were in (quasi) equilibrium.
Just because NASA does: Doesn't make it right or science.What I'm not seeing is anything that justifies adding 20ppm to the ice core data to line it up with ML. We do see a small lag of a few ppm in antarctica vs ML, but currently CO2 levels are increasing by a few ppm very year - from sources mostly in the northern hemisphere. It's not clear that even that small difference would be there in the past when CO2 levels were in (quasi) equilibrium.
Edited by kerplunk on Thursday 5th October 14:35
kerplunk said:
Didn't say it does. You've asserted it's unsound thing to do but provided no evidence for that assertion. The one yearly map you found to show Antarctica is 'nowhere near 400pm' would have been good support for your argument had it been valid. Now you need somthing else but I'm not following you down the absurd route of cherry-picked snaphots of seasonal fluxes. I'll leave you to it.
FFS it is lying by charts 101. Splicing data of different time resolutions without normalising the data first is not science it is lying. Irrespective of using data from two different locations (and ice core data is not the same as polar atmospheric data which is not the same as atmospheric data on a volcanic isle) that may currently appear to be similar (of which I doubt) does not mean they did not diverge in the past (think Yamal) .This is not an assertion this is basic science.
If you want I can show you a lovely set of equations proving 1 = 2 - the trick is of course covering up a step where you divide the equations by the equivalent of (a-a) (dividing by zero) it looks like calculus it follows many of the rules of calculus but uses a step that should not ever be done. The splicing of the data onto the same chart is such a step.
I don't have the raw O2O data. Whilst there may have been errors in the collation by an external entity does not mean there is no difference (lack of evidence is not evidence of lack) and the actual values are not that relevant to the splicing issue.
Jinx said:
If you want I can show you a lovely set of equations proving 1 = 2
I created a proof that 1 = 0 that my A level maths teacher could not immediately see how I'd managed was fun - having the natural log of a negative number then losing it was the trick there.Back to the point I've been reconcile how any increase in CO2 does not just lead to a runaway greenhouse situation. There has to be something that limits this, records show CO2 initially lagging temperature changes by 600 to 800 years, some explanations say this is due to increase insolation raising ocean temperatures which releases CO2 due to decreased solubility. This is a relatively small change compared to the increase in solubility due to the increase in partial pressure of CO2, records show this has risen by over a third recently. Some cycling could be expected due to cooling and increased volume from melting ice which would further increase the capacity of the oceans to hold CO2, which is then complicated with long term heat flows across the planets oceans.
Ignoring recent CO2 leading or at least very close to temperature changes what is the mechanism that ultimately limits the high temperature/CO2 cycles over the last 400k years? This must be something quite slow acting given the shape of the historic cycles.
Jinx said:
hairykrishna said:
Exactly which splice are you talking about? Reference?
The splicing that talks about 400 ppm verses the 300,000 years of ice core CO2 data.Google is your friend (loads available):

BTW - Nice graph you had - notice how there isn't a simple transformation from the polar data to the Mauna Loa?
Edited by Jinx on Wednesday 4th October 15:54
budgie smuggler said:
So you don't actually care about keeping the planet in the conditions which allow humans (and all currently alive creatures) to exist? As long Earth has had those conditions before at some time, no matter.
If that is your aim then CO2 is irrelevant.A big contaminant today is depleted uranium, a highly poisonous substance being sprayed around the world (both by wars and fracking) that has a half life of 4.5bn years - the age of the planet. In 4bn years the sun is expected to eat us anyway.
Then you have the Pacific filling up with toxic radio isotopes pumped in from Fukushima 24 hours a day, everyday, having been measured off the California coast now. Anecdotal evidence is that much of the coral life in Hawaii is now dead.
War, central-bank interest (economic growth) and sabotage/accidents are you #1 enemies here, CO2 is a distant runner up even if it did what you think it does. The world powers have a program of continuous war in store for all of us, good luck chasing CO2.
Globs said:
If that is your aim then CO2 is irrelevant.
A big contaminant today is depleted uranium, a highly poisonous substance being sprayed around the world (both by wars and fracking) that has a half life of 4.5bn years - the age of the planet. In 4bn years the sun is expected to eat us anyway.
Then you have the Pacific filling up with toxic radio isotopes pumped in from Fukushima 24 hours a day, everyday, having been measured off the California coast now. Anecdotal evidence is that much of the coral life in Hawaii is now dead.
A half life of 4.5bn years means that it's barely radioactive. It's the short half life stuff that you need to worry about. It's toxic because it's a heavy metal not because it's radioactive.A big contaminant today is depleted uranium, a highly poisonous substance being sprayed around the world (both by wars and fracking) that has a half life of 4.5bn years - the age of the planet. In 4bn years the sun is expected to eat us anyway.
Then you have the Pacific filling up with toxic radio isotopes pumped in from Fukushima 24 hours a day, everyday, having been measured off the California coast now. Anecdotal evidence is that much of the coral life in Hawaii is now dead.
Radioisotopes from Fukushima are not killing Hawaiian coral. Nor are they 'filling up' the pacific.
Edited by hairykrishna on Friday 6th October 11:36
hairykrishna said:
A half life of 4.5bn years means that it's barely radioactive. It's the short half life stuff that you need to worry about. It's toxic because it's a heavy metal not because it's radioactive.
Radioisotopes from Fukushima are not killing Hawaiian coral. Nor are they 'filling up' the pacific.
Yes, that's why I used the word 'toxic' rather than 'radioactive'. Radioisotopes from Fukushima are not killing Hawaiian coral. Nor are they 'filling up' the pacific.
https://duckduckgo.com/?q=depleted+uranium+illness...
You are confusing individual risk with planetary legacy. In terms of 'leaving the planet as we found it' (the post I was answering) it's the short half-life stuff we can ignore: bringing to the surface the long buried, lived toxic poisons are the legacy and will kill the most over time. Cs137 and Sr90 will only affect 2-3 generations: then it's gone. Also the Plutonium will last longer than human history, but in a million years won't be so much of an issue - maybe even the Marshall Islands will be OK by then.
You need to look into the health of the Pacific more, your bogus assumptions that 'everything's ok' are not shared by those reporting the problems.
https://duckduckgo.com/?q=fukushima+pacific+ocean+...
https://duckduckgo.com/?q=Alaska+fishing+fukushima...
The 'science' of CO2 has proven nothing except that we can steer scientists with grants and funding, in terms of actual people dead CO2 is rather neutral because it increased crop yields.
The real killers are war, pollution and industrialisation for central banker 'growth'. Effectively it is the central banking system that is killing the planet - which is why billions of people are being persuaded that CO2 is the enemy.
Since AGW came onto the scene I think the score must be around 5bn killed by banker driven wars and 0 by CO2. If we're being scientific about this the disparity must be taken into account when seeking to remedy global threats - and when it is, CO2 doesn't even register.
Globs said:
If that is your aim then CO2 is irrelevant.
A big contaminant today is depleted uranium, a highly poisonous substance being sprayed around the world (both by wars and fracking) that has a half life of 4.5bn years - the age of the planet. In 4bn years the sun is expected to eat us anyway.
Then you have the Pacific filling up with toxic radio isotopes pumped in from Fukushima 24 hours a day, everyday, having been measured off the California coast now. Anecdotal evidence is that much of the coral life in Hawaii is now dead.
War, central-bank interest (economic growth) and sabotage/accidents are you #1 enemies here, CO2 is a distant runner up even if it did what you think it does. The world powers have a program of continuous war in store for all of us, good luck chasing CO2.
I did a quick search on the DU and fracking claim and found this -A big contaminant today is depleted uranium, a highly poisonous substance being sprayed around the world (both by wars and fracking) that has a half life of 4.5bn years - the age of the planet. In 4bn years the sun is expected to eat us anyway.
Then you have the Pacific filling up with toxic radio isotopes pumped in from Fukushima 24 hours a day, everyday, having been measured off the California coast now. Anecdotal evidence is that much of the coral life in Hawaii is now dead.
War, central-bank interest (economic growth) and sabotage/accidents are you #1 enemies here, CO2 is a distant runner up even if it did what you think it does. The world powers have a program of continuous war in store for all of us, good luck chasing CO2.
https://www.rt.com/op-edge/fracking-radioactive-ur...
"Professor Busby is the Scientific Secretary of the European Committee on Radiation Risk based in Brussels"
Sounds really official until you dig a bit further and find out the European Committee on Radiation Risk is an informal group formed by the European Green party and is nothing in fact to do with the European Union or Commission. His main claim seems to be that because there are a couple of patents for using DU in shaped charges for fracking and that trying to find it in the output from a fracking rig is really difficult they must be using it.
"One of the worst radionuclides left behind is the Radon daughter Lead-210 which has a longish half-life (22 years) and builds up in these situations as a fine dust. It gets into the gas stream as nanoparticles and I believe it remains in the gas stream."
It does not matter what you believe, measure and prove it otherwise you are just relying on Miasma Theory.
Gassing Station | Science! | Top of Page | What's New | My Stuff