Climate Change - The Scientific Debate (Vol. II)
Discussion


I always wonder why a particular zero point is selected to say whether it is warmer or cooler.
Anyone care to comment on this graphic as it has a greater timescale than the below snap shot. https://www.climate.gov/sites/default/files/SOTC_g...
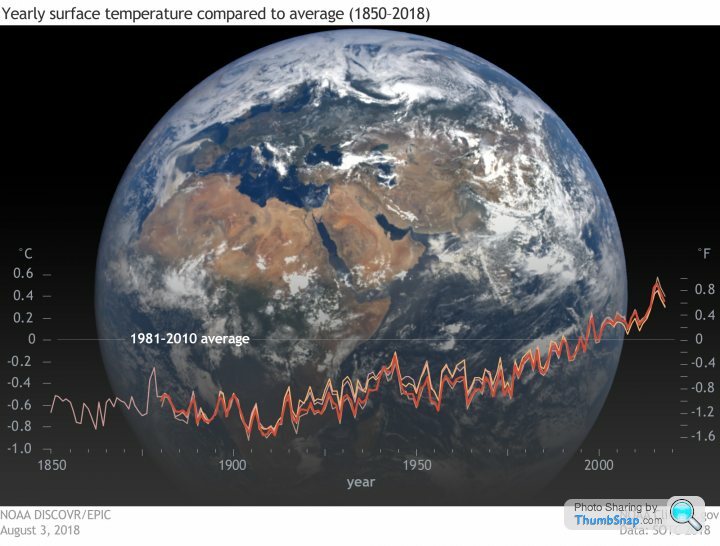
Anyone care to comment on this graphic as it has a greater timescale than the below snap shot. https://www.climate.gov/sites/default/files/SOTC_g...
There has been a lot of work done on that very point.
There are as many results as there are investigators - from good to no correlation!
Depending on analysis method.
Sunspot activity is related to solar cycle.
As solar cycles have an 11year period there should be an obvious 11year content to the temperature data. There isn't AFAIK.
Although there is the coincidence of Maunder minimum with the Little Ice Age. Maybe the effect is there but so weak as to be swamped by all other influences. Maybe only large, extended changes/inactivities affect.
The more the data is tortured the better the correlation. i.e. what is being demonstrated is curve fitting not correlation.
All IMHO of course
All agreed but.... solar cycle is not necessarily an accurate balancing measurement. Sorry, an unscientific term due to my ignorance. What I mean is every solar cycle does not necessarily have similar sun spot occurrences surely? An unpredictable number in any cycle would indicate changes that might have had a solar system-wide effect, so affecting predictability (which by its definition would be guesswork).
Thorodin said:
All agreed but.... solar cycle is not necessarily an accurate balancing measurement. Sorry, an unscientific term due to my ignorance. What I mean is every solar cycle does not necessarily have similar sun spot occurrences surely? An unpredictable number in any cycle would indicate changes that might have had a solar system-wide effect, so affecting predictability (which by its definition would be guesswork).
From wiki (other sources are available)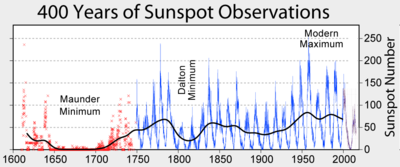
Yes sunspot numbers vary but there is a consistent pattern of peaks and troughs very closely correlated to the cycle.
It is this cyclic element that, if present, should be readily observable/derivable in temperature data. Much easier to see a repeating pattern's effect than a random signal. Even in the presence of a large number of unrelated signals.
There are analysis tools which can do this. I'm an electronics engineer so am familiar with Fourier analysis. Also see periodogram.
By breaking up temperature data into bands related to frequency content one might be expected to find a significant 11year content. Not there!
{wavy screen}...a green student apprentice Noise is working in railway signalling. A track circuit detects the presence of a train, useful to help stop them banging into each other, an undesirable thing

AC track circuits are a new thing, were DC. Railway environments are very electrically noisy. How do you reliably detect the presence (or absence) of a known frequency of AC signal in the presence of, especially 50 or 60Hz traction currents, very large amounts of noise?
One chap was using one of the first microcontrollers (8080 IIRC) with an external multiplier to do the maths of a Fourier transform to detect the frequency content of the track circuit, 33 1/3rd Hz. Subject of a patent at the time I think.
I did similar by discrete logic/analogue means switching capacitors to one inductor. In case software was unacceptable.
The signals were so noisy that it was impossible to visually see the presence of the track circuit on an oscilloscope. The Fourier analysis always differentiated 33&1/3Hz (or not).
This is interesting.
https://www.bbc.co.uk/news/world-australia-5169780...
Australia's summers have become twice as long as its winters amid increasing temperatures driven by climate change, according to new weather data analysis.
The Australia Institute found that summer across most of the country over the past 20 years was about a month longer than in the mid-20th century, while winters had become shorter.
Between 2014 and 2018, summers were found to be about 50% longer.
The findings followed Australia's warmest and driest year on record.
jet_noise said:
From wiki (other sources are available)
Yes sunspot numbers vary but there is a consistent pattern of peaks and troughs very closely correlated to the cycle.
It is this cyclic element that, if present, should be readily observable/derivable in temperature data. Much easier to see a repeating pattern's effect than a random signal. Even in the presence of a large number of unrelated signals.
There are analysis tools which can do this. I'm an electronics engineer so am familiar with Fourier analysis. Also see periodogram.
By breaking up temperature data into bands related to frequency content one might be expected to find a significant 11year content. Not there!
{wavy screen}...a green student apprentice Noise is working in railway signalling. A track circuit detects the presence of a train, useful to help stop them banging into each other, an undesirable thing
AC track circuits are a new thing, were DC. Railway environments are very electrically noisy. How do you reliably detect the presence (or absence) of a known frequency of AC signal in the presence of, especially 50 or 60Hz traction currents, very large amounts of noise?
One chap was using one of the first microcontrollers (8080 IIRC) with an external multiplier to do the maths of a Fourier transform to detect the frequency content of the track circuit, 33 1/3rd Hz. Subject of a patent at the time I think.
I did similar by discrete logic/analogue means switching capacitors to one inductor. In case software was unacceptable.
The signals were so noisy that it was impossible to visually see the presence of the track circuit on an oscilloscope. The Fourier analysis always differentiated 33&1/3Hz (or not).
Wow, fascinating. Thanks for that.Yes sunspot numbers vary but there is a consistent pattern of peaks and troughs very closely correlated to the cycle.
It is this cyclic element that, if present, should be readily observable/derivable in temperature data. Much easier to see a repeating pattern's effect than a random signal. Even in the presence of a large number of unrelated signals.
There are analysis tools which can do this. I'm an electronics engineer so am familiar with Fourier analysis. Also see periodogram.
By breaking up temperature data into bands related to frequency content one might be expected to find a significant 11year content. Not there!
{wavy screen}...a green student apprentice Noise is working in railway signalling. A track circuit detects the presence of a train, useful to help stop them banging into each other, an undesirable thing
AC track circuits are a new thing, were DC. Railway environments are very electrically noisy. How do you reliably detect the presence (or absence) of a known frequency of AC signal in the presence of, especially 50 or 60Hz traction currents, very large amounts of noise?
One chap was using one of the first microcontrollers (8080 IIRC) with an external multiplier to do the maths of a Fourier transform to detect the frequency content of the track circuit, 33 1/3rd Hz. Subject of a patent at the time I think.
I did similar by discrete logic/analogue means switching capacitors to one inductor. In case software was unacceptable.
The signals were so noisy that it was impossible to visually see the presence of the track circuit on an oscilloscope. The Fourier analysis always differentiated 33&1/3Hz (or not).
Silkyskills said:
This is interesting.
https://www.bbc.co.uk/news/world-australia-5169780...
Australia's summers have become twice as long as its winters amid increasing temperatures driven by climate change, according to new weather data analysis.
The Australia Institute found that summer across most of the country over the past 20 years was about a month longer than in the mid-20th century, while winters had become shorter.
Between 2014 and 2018, summers were found to be about 50% longer.
The findings followed Australia's warmest and driest year on record.
What are the odds of that happening?https://www.bbc.co.uk/news/world-australia-5169780...
Australia's summers have become twice as long as its winters amid increasing temperatures driven by climate change, according to new weather data analysis.
The Australia Institute found that summer across most of the country over the past 20 years was about a month longer than in the mid-20th century, while winters had become shorter.
Between 2014 and 2018, summers were found to be about 50% longer.
The findings followed Australia's warmest and driest year on record.
Well about 100% when you keep changing the historic figures.....
https://jennifermarohasy.com/2019/02/met-bureau-re...
Silkyskills said:
This is interesting.
https://www.bbc.co.uk/news/world-australia-5169780...
Australia's summers have become twice as long as its winters amid increasing temperatures driven by climate change, according to new weather data analysis.
The Australia Institute found that summer across most of the country over the past 20 years was about a month longer than in the mid-20th century, while winters had become shorter.
Between 2014 and 2018, summers were found to be about 50% longer.
The findings followed Australia's warmest and driest year on record.
 and have another
 Jinx said:
Silkyskills said:
This is interesting.
https://www.bbc.co.uk/news/world-australia-5169780...
Australia's summers have become twice as long as its winters amid increasing temperatures driven by climate change, according to new weather data analysis.
The Australia Institute found that summer across most of the country over the past 20 years was about a month longer than in the mid-20th century, while winters had become shorter.
Between 2014 and 2018, summers were found to be about 50% longer.
The findings followed Australia's warmest and driest year on record.
What are the odds of that happening?https://www.bbc.co.uk/news/world-australia-5169780...
Australia's summers have become twice as long as its winters amid increasing temperatures driven by climate change, according to new weather data analysis.
The Australia Institute found that summer across most of the country over the past 20 years was about a month longer than in the mid-20th century, while winters had become shorter.
Between 2014 and 2018, summers were found to be about 50% longer.
The findings followed Australia's warmest and driest year on record.
Well about 100% when you keep changing the historic figures.....
https://jennifermarohasy.com/2019/02/met-bureau-re...
Silkyskills said:
If they are pushing up (recalibrating) the temperatures in the mid 20th century then that surely makes the temps between 2014 and 2018 even more concerning. If they were reducing them I could see a logical flaw in the argument.
There is a long list of [cough]recallibration[/cough] going on at BOM (latest one on J.Marohasy blog - https://jennifermarohasy.com/2020/03/warming-marbl...) all of which show that you can't trust any of the ACORN v2 data so all news stories based on it are a fabrication.mko9 said:
Shouldn't the zero average be the longest period possible of good solid data, rather than some short, seemingly arbitrary block of our recent living memory?
kerplunk said:
What difference does it make where the zero line is, it doesn't affect the trend. I don't get the (regular) mithering over it.
Thank you for that brilliantly insightful comment to my post that didn't mention the trend line in any way. I was saying the zero line seems to stupid, and not based on any science. Just an arbitrary line to measure against. Just label the x-axis with what it actually is.mko9 said:
mko9 said:
Shouldn't the zero average be the longest period possible of good solid data, rather than some short, seemingly arbitrary block of our recent living memory?
kerplunk said:
What difference does it make where the zero line is, it doesn't affect the trend. I don't get the (regular) mithering over it.
Thank you for that brilliantly insightful comment to my post that didn't mention the trend line in any way. I was saying the zero line seems to stupid, and not based on any science. Just an arbitrary line to measure against. Just label the x-axis with what it actually is."Just label the x-axis with what it actually is"
Do you mean absolute temperature in C? Then the zero line becomes the freezing point of water - why use that?

Maybe your question is 'why use anomaly values not absolute temps?'
https://www.google.com/search?client=firefox-b-d&a...
kerplunk said:
Yes it's a fairly arbitrary line to measure change (the thing we're interested in) against.
"Just label the x-axis with what it actually is"
Do you mean absolute temperature in C? Then the zero line becomes the freezing point of water - why use that?
Maybe your question is 'why use anomaly values not absolute temps?'
https://www.google.com/search?client=firefox-b-d&a...
Erm should use K as this is the science thread....."Just label the x-axis with what it actually is"
Do you mean absolute temperature in C? Then the zero line becomes the freezing point of water - why use that?
Maybe your question is 'why use anomaly values not absolute temps?'
https://www.google.com/search?client=firefox-b-d&a...
Jinx said:
kerplunk said:
Yes it's a fairly arbitrary line to measure change (the thing we're interested in) against.
"Just label the x-axis with what it actually is"
Do you mean absolute temperature in C? Then the zero line becomes the freezing point of water - why use that?
Maybe your question is 'why use anomaly values not absolute temps?'
https://www.google.com/search?client=firefox-b-d&a...
Erm should use K as this is the science thread....."Just label the x-axis with what it actually is"
Do you mean absolute temperature in C? Then the zero line becomes the freezing point of water - why use that?
Maybe your question is 'why use anomaly values not absolute temps?'
https://www.google.com/search?client=firefox-b-d&a...
This subject has become far too captivating for me - I'm out before I get addicted.
So, science. Whilst we all stress about a tenth of a degree here and there, this is what is being hidden behind the climate change smoke screen: https://www.bbc.com/future/article/20150402-the-wo...
The race for the rare earth metals that make up batteries, wind turbines etc cause this...

The race for the rare earth metals that make up batteries, wind turbines etc cause this...
Bush fire risk increased massively due to climate change says scientific report.
https://www.bbc.co.uk/news/science-environment-517...
https://www.bbc.co.uk/news/science-environment-517...
Gassing Station | Science! | Top of Page | What's New | My Stuff