Car Survival Rate Analysis
Discussion


Truckosaurus said:
Top Stating Car Nut.
It is interesting that the Land Cruiser, which is meant to be the sturdiest 4x4, at 56% and the Frontera, which is meant to be the most unreliable 4x4, at 78%.
I suspect the lack of 'cruisers is due to them being exported.
Is the number of exported vehicles available anywhere?
I think that you are spot on Truckosaurus - in my view the Land Cruiser is one of the handful of models whose survival rates are badly affected by exports, you will see this impact on the luxury car analysis which I will post up, once the discussion on family hatchbacks appears to have come to a conclusion. Fortunately, there is a dodge that I discovered to get round this problem, will use the same when we come to luxury SUVs. It is interesting that the Land Cruiser, which is meant to be the sturdiest 4x4, at 56% and the Frontera, which is meant to be the most unreliable 4x4, at 78%.
I suspect the lack of 'cruisers is due to them being exported.
Is the number of exported vehicles available anywhere?
There was a report by that a German consultancy firm produced for the European Commission in 2011 that I found that did quantify it, but then some more digging revealed that the number is highly variable, and that 2010 (the year that the analysis was based on) had been a particularly low year. Will find the link to it again.
Mind you one of the local farmers was often seen in his fields in a Land Cruiser, before it suddenly became a quad bike last year. The story that I got secondhand, was that the hill descent system failed, and that screws the brakes up, so he scrapped it.
Edited by Car_Nut on Tuesday 4th April 12:32
Riley Blue said:
It's by sector, e.g. town car, SUV, luxury/executive etc.
Very interesting comment re. Jaguar XJ350 v Audi A8 though in my experience as an A8 owner not at all surprising!
I suspect the survival rate for the XJ X350 is down to the demographics of the people who buy them. There are quite a lot of low mileage examples around.Very interesting comment re. Jaguar XJ350 v Audi A8 though in my experience as an A8 owner not at all surprising!
xjay1337 said:
lee_erm said:
I see them constantly here in the North West.
Yeah, I live in the South so maybe it's a north/south divide thing 
I can't wait to see the slow, steady, inevitable death of the Vauxhall Insignia.
Car_Nut said:
I think that you are spot on Truckosaurus - in my view the Land Cruiser is one of the handful of models whose survival rates are badly effected by exports, you will see this impact on the luxury car analysis which I will post up, once the discussion on family hatchbacks appears to have come to a conclusion. Fortunately, there is a dodge that I discovered to get round this problem, will use the same when we come to luxury SUVs.
There was a report by that a German consultancy firm produced for the European Commission in 2011 that I found that did quantify it, but then some more digging revealed that the number is highly variable, and that 2010 (the year that the analysis was based on) had been a particularly low year. Will find the link to it again.
Mind you one of the local farmers was often seen in his fields in a Land Cruiser, before it suddenly became a quad bike last year. The story that I got secondhand, was that the hill decent system failed, and that screws the brakes up, so he scrapped it.
The net flow of vehicles imported / exported will be highly dependent on foreign exchange rates and governement taxes/regs between the U.K. And any given country, so I would expect one year's figures to be quite unreliable as an indicator for a general export/import %.There was a report by that a German consultancy firm produced for the European Commission in 2011 that I found that did quantify it, but then some more digging revealed that the number is highly variable, and that 2010 (the year that the analysis was based on) had been a particularly low year. Will find the link to it again.
Mind you one of the local farmers was often seen in his fields in a Land Cruiser, before it suddenly became a quad bike last year. The story that I got secondhand, was that the hill decent system failed, and that screws the brakes up, so he scrapped it.
sealtt said:
The net flow of vehicles imported / exported will be highly dependent on foreign exchange rates and governement taxes/regs between the U.K. And any given country, so I would expect one year's figures to be quite unreliable as an indicator for a general export/import %.
Agree totally.
Car_Nut said:
Truckosaurus said:
Top Stating Car Nut.
It is interesting that the Land Cruiser, which is meant to be the sturdiest 4x4, at 56% and the Frontera, which is meant to be the most unreliable 4x4, at 78%.
I suspect the lack of 'cruisers is due to them being exported.
Is the number of exported vehicles available anywhere?
I think that you are spot on Truckosaurus - in my view the Land Cruiser is one of the handful of models whose survival rates are badly effected by exports, you will see this impact on the luxury car analysis which I will post up, once the discussion on family hatchbacks appears to have come to a conclusion. Fortunately, there is a dodge that I discovered to get round this problem, will use the same when we come to luxury SUVs. It is interesting that the Land Cruiser, which is meant to be the sturdiest 4x4, at 56% and the Frontera, which is meant to be the most unreliable 4x4, at 78%.
I suspect the lack of 'cruisers is due to them being exported.
Is the number of exported vehicles available anywhere?
I'm told engines and gearboxes from non-Japanese 4x4s are in much less demand for export, so these vehicles are perhaps more likely to be run into the ground.
LUXURY CARS
This is a lightly re-worked version of my earlier post, in which none of the data of graphs differ: changes have been confined to text editing to reflect the different discussions that have taken place on the thread, to remove thread specific references, and the fact that we are low higher up the subject’s learning curve.
I have selected the following cars in this market segment:
The variants of these models included in the 2001 to 2015 database are as follows:

It can be seen that sales of these five models have declined, the decrease being from 9,720 in 2001 to 6,026 in 2015, considering Great Britain only. This is a decrease of some 38%. It can also be seen that the main fall corresponded with the 2008 financial crash, since when there has been a slight recovery. The relevant numbers from 2007 to 2009 were 8,383, 6,304, and 4,515 respectively. Given the target market for these cars, I suggest that this is unsurprising. I would also suggest that in this sector of the market there are other choices that could be made outwith the segment, of which the Range Rover is the most obvious, and these have been abstracting sales.
It can also be seen that from 2010 onwards, sales of the Lexus LS have decreased to a level that I would consider below that at which analysis is statistically significant, the nadir (to date) being the 21 vehicles registered in 2012. Accordingly, although I have stuck the survival curve for LSs registered up to 2014 on the graph, for reference, I have not analysed the model post-2010.
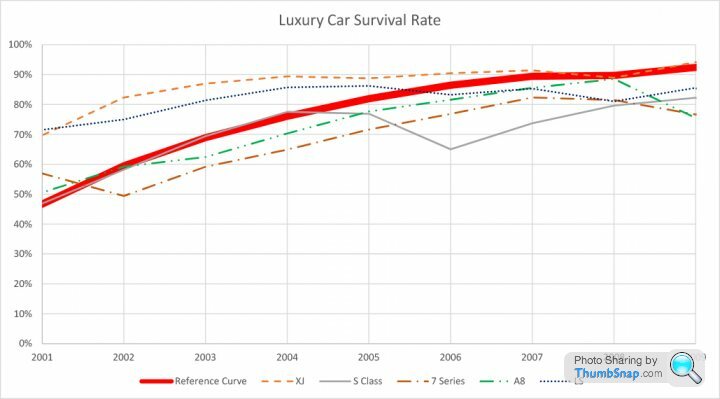
Moving onto the survival curve for 2001 to 2014:

As can be seen, the results are somewhat erratic. This appears to be as a result of the impact of used exports; while it affects only a minority of cars, it is still sufficient to confuse the results, when the number of survivors is high. As we have discussed, used car export rates are somewhat volatile, as the survival rates peak for cars registered in the 2008-10 period (2010 for the Audi A8, 2009 for the Jaguar XJ and Mercedes S Class, 2007-8 for the BMW 7 series) it would imply that the used car exports are higher than they were about five years ago. Clearly, this is a grossly over-simplistic assertion, as the used car export market is not a single entity, but a diverse network of different markets, each with its own typical vehicle age profile.
I presume that, again this window of reduced exports was tied into the 2008 crash and its aftershocks, as another interesting finding is that about 5% of new registrations of all of these cars disappear in the first year (presumably being only registered first in the UK as a tax saving wheeze), and that a total of 10-15% disappear over the first four years. This applies to all of these cars, the percentage of UK survivors for cars registered in 2015, 2014, 2013 and 2012, respectively for these models, as at 31 December 2015, are as follows:
It is of note that one could assume that that the average age of the 4.3% to 7.7% of cars that disappear in the first year is just six months. It would appear that fewer XJs are exported as used cars than their German rivals, but that the difference is not great.
Moving on to zooming in on the 2001 to 2009 portion of the graph that is more interesting:
Well this is slightly more useful, but the graph is still rather suffering from the impact of car exports. Accordingly, to try and get a handle on survivability I have looked at the percentage of British survivors that are still taxed. The theory being that this type and age of car is unlikely to be stashed away by collectors, and that, for cars of this nature, many of their owners are reluctant to send them to the scrappy when they are no longer roadworthy, and thus the proportion that are taxed, and thus roadworthy, is an indicator of survivability. In the graph, I am afraid that I have had to supress the zero for legibility, which is a practice that I dislike as it distorts the presentation of relative values (which is why this is common trick of tabloid newspapers, of course).

Drawing firm conclusions in this market segment is less easy than for anything else that we have examined thus far. However, I consider that we could draw the following conclusions:
Audi A8: there are two distinct trend curves, discernible in both the survival rate curves and in the probability of keeping an A8 on the road: that for 2001 and 2002, mainly First Generation cars, being appreciably above that for Second Generation cars from 2003 onwards: there is an (approx.) 6% reduction in the survival rate once the Second Generation cars appear. It is tempting to ascribe this to the naughties deterioration in the quality of Volkswagen Group products that several of us on this website believe in, but maybe an expert on the model can enlighten us? It is not yet possible to determine any difference in the inherent survival rates of Second and Third Generation cars. Overall the chances of keeping an A8 on the road are well aligned to that of the 7 Series and S Class: a little above them in the case of a First Generation car and a little below them in the case of a Second Generation Car.
BMW 7 Series: one could tentatively draw a conclusion that E38 survives better than the E65, given that 2001 data is dominated by the E38, but it is dangerous to draw firm conclusions on the basis of only one year’s data. But we can certainly say that there does appear to be a significant issue with keeping 2002 E65s on the road, the probability of which is some 26% below that of 2003 cars, and 18% lower than 2001 cars, but that from 2003 onwards the position improves dramatically, although the trend line is below the single point of E38 data. Indeed, it is even possible that the 2001 E38 data is dragged down by the inclusion of some early E65s. Again, can any experts in the model enlighten us please? It is not yet possible to draw any conclusions over the inherent F01 survival rate. Apart from the 2002 blip the chances of keeping a 7 Series on the road seem broadly aligned with it two great German competitors.
Jaguar XJ: there is clear and substantial step up in survival rates with the introduction of the X350, the gross differential at the step appearing to be of the order of 12%, gross: one of the largest jumps we have seen in a model. The survival of the earlier X308 (on the basis of the proportion taxed) is comparable with its German rivals, but inferior to the Lexus LS, but the X350 appears to have survivability that increases over its rivals as time goes by: there is a noticeably flatter curve to the probability of being taxed against age for the X350 than is the case for the other cars considered, if this were to continue for the next couple of years surviving XJ would start to greatly outnumber their rivals, other than pre-2004 Lexus LSs, as they pass their fifteenth birthdays. It is not yet possible to determine whether the inherent survival rate will be affected by the transitions to the X358 and X351.
Lexus LS: the probability of an LS being still roadworthy drops sharply for cars built from 2004 onwards, this corresponds with a mid-life update of the XF30. This is, however, less apparent in the overall survival rate. Pre-2004 LS have impressive survival and roadworthiness rates that are comparable with those for the X350 Jaguar XJ, and way better than everything in the pre-X350 era. Post 2004, the proportion of LSs that are taxed are comparable with their German rivals. A deterioration in the survival rate of Toyota products in the mid-2000s, is something that we saw with the Corolla, and we will see it again with other Toyota models, this is a theme that I will return to as the evidence piles up. If is too early to draw any definitive conclusions on the relative inherent survivability between the XF30 and the XF40, although it appears that there might be the beginnings of another downward blip at the model change, but time will tell.
Mercedes S Class: there might be a slight downward blip in survivability in the transition between the W220 and the W221, but we would need another couple of years of data to confirm or deny this. Roadworthiness and survival rates for the W220 wobble slightly in 2002, but not as dramatically as is the case for the A8. It might be that the improvements in the figures for 2003 is as a result of improvements in Mercedes quality following the well-known millennial era issues for the brand. In general, as the cars age, the proportion of taxed Mercedes is fractionally above that of the other two German brands but below than of Jaguars and pre-2004 Lexus LSs, other than in the case of First Generation Audi A8s and X308 Jaguar XJs.
Overall, the XJ and LS retain a clear survivability advantage over their rivals indicated in my earlier analysis of the howmanyleft.com data, but this is reduced. The three German cars are closely matched, other than a wobble from the 7 Series in 2002, following the introduction of the E65.
I will be tackling something more straightforward next! Hopefully, a family holiday in a couple of weeks will enable me to polish off the updated supermini analysis: an ideal marriage, while my wife reads a book in the evenings, in the holiday cottage, I will be tapping away at car statistics on my laptop. In the meantime I have a few interesting graphs and tables that I prepared earlier that might be of interest.
As ever, please feel free to post up any interesting survival stats of your own: I will be as interested as anybody else to see them, and am perfectly happy not to be a one man show.
This is a lightly re-worked version of my earlier post, in which none of the data of graphs differ: changes have been confined to text editing to reflect the different discussions that have taken place on the thread, to remove thread specific references, and the fact that we are low higher up the subject’s learning curve.
I have selected the following cars in this market segment:
- Audi A8
- BMW 7 Series
- Jaguar XJ
- Lexus LS
- Mercedes S Class
The variants of these models included in the 2001 to 2015 database are as follows:
- Audi A8: First Generation to 2002, Second Generation 2002 to 2010, Third Generation 2010 onwards.
- BMW 7 Series: E38 to 2001, E65 2001 to 2008, F01 2008 to 2015.
- Jaguar XJ: X308 to 2002, X350/X358 2002 to 2009 (X350 to X358 transition 2007), X351 2009 onwards.
- Lexus LS: XF30 to 2006 (LS 430), XF40 (LS 460) 2006 to date.
- Mercedes S Class: W220 to 2006, W221 2006 to 2013, W22 2013 onwards.
It can be seen that sales of these five models have declined, the decrease being from 9,720 in 2001 to 6,026 in 2015, considering Great Britain only. This is a decrease of some 38%. It can also be seen that the main fall corresponded with the 2008 financial crash, since when there has been a slight recovery. The relevant numbers from 2007 to 2009 were 8,383, 6,304, and 4,515 respectively. Given the target market for these cars, I suggest that this is unsurprising. I would also suggest that in this sector of the market there are other choices that could be made outwith the segment, of which the Range Rover is the most obvious, and these have been abstracting sales.
It can also be seen that from 2010 onwards, sales of the Lexus LS have decreased to a level that I would consider below that at which analysis is statistically significant, the nadir (to date) being the 21 vehicles registered in 2012. Accordingly, although I have stuck the survival curve for LSs registered up to 2014 on the graph, for reference, I have not analysed the model post-2010.
Moving onto the survival curve for 2001 to 2014:
As can be seen, the results are somewhat erratic. This appears to be as a result of the impact of used exports; while it affects only a minority of cars, it is still sufficient to confuse the results, when the number of survivors is high. As we have discussed, used car export rates are somewhat volatile, as the survival rates peak for cars registered in the 2008-10 period (2010 for the Audi A8, 2009 for the Jaguar XJ and Mercedes S Class, 2007-8 for the BMW 7 series) it would imply that the used car exports are higher than they were about five years ago. Clearly, this is a grossly over-simplistic assertion, as the used car export market is not a single entity, but a diverse network of different markets, each with its own typical vehicle age profile.
I presume that, again this window of reduced exports was tied into the 2008 crash and its aftershocks, as another interesting finding is that about 5% of new registrations of all of these cars disappear in the first year (presumably being only registered first in the UK as a tax saving wheeze), and that a total of 10-15% disappear over the first four years. This applies to all of these cars, the percentage of UK survivors for cars registered in 2015, 2014, 2013 and 2012, respectively for these models, as at 31 December 2015, are as follows:
| Car | 2015 | 2014 | 2013 | 2012 |
|---|---|---|---|---|
| Audi A8 | 94.0% | 92.3% | 84.3% | 85.5% |
| BMW 7 Series | 93.4% | 91.7% | 86.4% | 85.6% |
| Jaguar XJ | 95.7% | 94.3% | 94.8% | 89.9% |
| Mercedes S Class | 94.1% | 84.4% | 87.7% | 85.3% |
It is of note that one could assume that that the average age of the 4.3% to 7.7% of cars that disappear in the first year is just six months. It would appear that fewer XJs are exported as used cars than their German rivals, but that the difference is not great.
Moving on to zooming in on the 2001 to 2009 portion of the graph that is more interesting:
Well this is slightly more useful, but the graph is still rather suffering from the impact of car exports. Accordingly, to try and get a handle on survivability I have looked at the percentage of British survivors that are still taxed. The theory being that this type and age of car is unlikely to be stashed away by collectors, and that, for cars of this nature, many of their owners are reluctant to send them to the scrappy when they are no longer roadworthy, and thus the proportion that are taxed, and thus roadworthy, is an indicator of survivability. In the graph, I am afraid that I have had to supress the zero for legibility, which is a practice that I dislike as it distorts the presentation of relative values (which is why this is common trick of tabloid newspapers, of course).
Drawing firm conclusions in this market segment is less easy than for anything else that we have examined thus far. However, I consider that we could draw the following conclusions:
Audi A8: there are two distinct trend curves, discernible in both the survival rate curves and in the probability of keeping an A8 on the road: that for 2001 and 2002, mainly First Generation cars, being appreciably above that for Second Generation cars from 2003 onwards: there is an (approx.) 6% reduction in the survival rate once the Second Generation cars appear. It is tempting to ascribe this to the naughties deterioration in the quality of Volkswagen Group products that several of us on this website believe in, but maybe an expert on the model can enlighten us? It is not yet possible to determine any difference in the inherent survival rates of Second and Third Generation cars. Overall the chances of keeping an A8 on the road are well aligned to that of the 7 Series and S Class: a little above them in the case of a First Generation car and a little below them in the case of a Second Generation Car.
BMW 7 Series: one could tentatively draw a conclusion that E38 survives better than the E65, given that 2001 data is dominated by the E38, but it is dangerous to draw firm conclusions on the basis of only one year’s data. But we can certainly say that there does appear to be a significant issue with keeping 2002 E65s on the road, the probability of which is some 26% below that of 2003 cars, and 18% lower than 2001 cars, but that from 2003 onwards the position improves dramatically, although the trend line is below the single point of E38 data. Indeed, it is even possible that the 2001 E38 data is dragged down by the inclusion of some early E65s. Again, can any experts in the model enlighten us please? It is not yet possible to draw any conclusions over the inherent F01 survival rate. Apart from the 2002 blip the chances of keeping a 7 Series on the road seem broadly aligned with it two great German competitors.
Jaguar XJ: there is clear and substantial step up in survival rates with the introduction of the X350, the gross differential at the step appearing to be of the order of 12%, gross: one of the largest jumps we have seen in a model. The survival of the earlier X308 (on the basis of the proportion taxed) is comparable with its German rivals, but inferior to the Lexus LS, but the X350 appears to have survivability that increases over its rivals as time goes by: there is a noticeably flatter curve to the probability of being taxed against age for the X350 than is the case for the other cars considered, if this were to continue for the next couple of years surviving XJ would start to greatly outnumber their rivals, other than pre-2004 Lexus LSs, as they pass their fifteenth birthdays. It is not yet possible to determine whether the inherent survival rate will be affected by the transitions to the X358 and X351.
Lexus LS: the probability of an LS being still roadworthy drops sharply for cars built from 2004 onwards, this corresponds with a mid-life update of the XF30. This is, however, less apparent in the overall survival rate. Pre-2004 LS have impressive survival and roadworthiness rates that are comparable with those for the X350 Jaguar XJ, and way better than everything in the pre-X350 era. Post 2004, the proportion of LSs that are taxed are comparable with their German rivals. A deterioration in the survival rate of Toyota products in the mid-2000s, is something that we saw with the Corolla, and we will see it again with other Toyota models, this is a theme that I will return to as the evidence piles up. If is too early to draw any definitive conclusions on the relative inherent survivability between the XF30 and the XF40, although it appears that there might be the beginnings of another downward blip at the model change, but time will tell.
Mercedes S Class: there might be a slight downward blip in survivability in the transition between the W220 and the W221, but we would need another couple of years of data to confirm or deny this. Roadworthiness and survival rates for the W220 wobble slightly in 2002, but not as dramatically as is the case for the A8. It might be that the improvements in the figures for 2003 is as a result of improvements in Mercedes quality following the well-known millennial era issues for the brand. In general, as the cars age, the proportion of taxed Mercedes is fractionally above that of the other two German brands but below than of Jaguars and pre-2004 Lexus LSs, other than in the case of First Generation Audi A8s and X308 Jaguar XJs.
Overall, the XJ and LS retain a clear survivability advantage over their rivals indicated in my earlier analysis of the howmanyleft.com data, but this is reduced. The three German cars are closely matched, other than a wobble from the 7 Series in 2002, following the introduction of the E65.
I will be tackling something more straightforward next! Hopefully, a family holiday in a couple of weeks will enable me to polish off the updated supermini analysis: an ideal marriage, while my wife reads a book in the evenings, in the holiday cottage, I will be tapping away at car statistics on my laptop. In the meantime I have a few interesting graphs and tables that I prepared earlier that might be of interest.
As ever, please feel free to post up any interesting survival stats of your own: I will be as interested as anybody else to see them, and am perfectly happy not to be a one man show.
Edited by Car_Nut on Tuesday 4th April 23:39
One of the pieces of the picture is to understand how the numbers of popular models decay away over time. I have a couple of examples of this: the Metro/Rover 100 and the Saab 9000.
At one time Metros were everywhere, being Britain’s best-selling car in its early life. Introduced in 1980 and finally discontinued in 1998, they are now extinct for practical purposes. The graph below shows the number registered between 1994 and 30 September 2016 and is fairly self- explanatory.

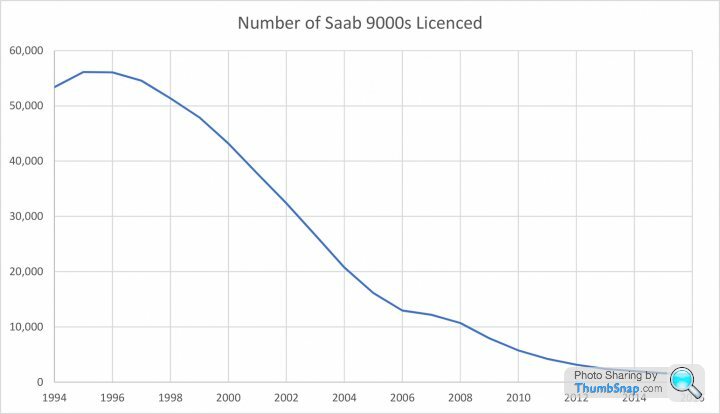
I have carried out a little more detailed analysis of the Saab 9000 (1984-98). As we can see from the graph below, the maximum number registered in Britain peaked in 1995, two to three years before the model was discontinued, as dwindling sales failed to keep up with attrition.
Something that I have not shown before is some analysis that I undertook looking at the survival of particular variants. What is notable is the incredibly uneven way that the grim reaper has attacked different variants. As we have seen before, it is the more “interesting” variants that tend to survive best.
At one time Metros were everywhere, being Britain’s best-selling car in its early life. Introduced in 1980 and finally discontinued in 1998, they are now extinct for practical purposes. The graph below shows the number registered between 1994 and 30 September 2016 and is fairly self- explanatory.
I have carried out a little more detailed analysis of the Saab 9000 (1984-98). As we can see from the graph below, the maximum number registered in Britain peaked in 1995, two to three years before the model was discontinued, as dwindling sales failed to keep up with attrition.
Something that I have not shown before is some analysis that I undertook looking at the survival of particular variants. What is notable is the incredibly uneven way that the grim reaper has attacked different variants. As we have seen before, it is the more “interesting” variants that tend to survive best.
| Variant | Max No Registered | 2016 Survivors | Survival Rate |
|---|---|---|---|
| 9000 CD AUTO | 309 | 4 | 1.29% |
| 9000 CD CARLSSON TURBO | 85 | 4 | 4.71% |
| 9000 CD CARLSSON TURBO A | 249 | 10 | 4.02% |
| 9000 CD GRIFFIN 3.0 V6 | 3 | 1 | 33.33% |
| 9000 CD GRIFFIN 3.0 V6 A | 237 | 8 | 3.38% |
| 9000 CD GRIFFIN TURBO | 3 | 1 | 33.33% |
| 9000 CD GRIFFIN TURBO AUTO | 93 | 15 | 16.13% |
| 9000 CD TURBO | 42 | 1 | 2.38% |
| 9000 CD TURBO AUTO | 24 | 0 | 0.00% |
| 9000 CD XS | 154 | 6 | 3.90% |
| 9000 CD XS I | 533 | 2 | 0.38% |
| 9000 CD XS I AUTO | 168 | 0 | 0.00% |
| 9000 CDE | 822 | 8 | 0.97% |
| 9000 CDE AUTO | 1,007 | 6 | 0.60% |
| 9000 CDE ECOPOWER | 400 | 21 | 5.25% |
| 9000 CDE ECOPOWER AUTO | 578 | 25 | 4.33% |
| 9000 CDE GRIFFIN | 10 | 1 | 10.00% |
| 9000 CDE GRIFFIN A | 437 | 19 | 4.35% |
| 9000 CDE TURBO | 446 | 9 | 2.02% |
| 9000 CDE TURBO AUTO | 655 | 14 | 2.14% |
| 9000 CDI | 2,142 | 23 | 1.07% |
| 9000 CDI AUTO | 1,207 | 38 | 3.15% |
| 9000 CDI S | 1,552 | 7 | 0.45% |
| 9000 CDI S AUTO | 1,013 | 6 | 0.59% |
| 9000 CDS TURBO | 152 | 0 | 0.00% |
| 9000 CDS TURBO AUTO | 73 | 1 | 1.37% |
| 9000 CS | 156 | 12 | 7.69% |
| 9000 CS AUTO | 122 | 16 | 13.11% |
| 9000 CS I | 2,509 | 30 | 1.20% |
| 9000 CS I AUTO | 698 | 8 | 1.15% |
| 9000 CS TURBO | 2,435 | 100 | 4.11% |
| 9000 CS TURBO AUTO | 2,038 | 97 | 4.76% |
| 9000 CS XS | 187 | 3 | 1.60% |
| 9000 CS XS I | 440 | 1 | 0.23% |
| 9000 CS XS I AUTO | 109 | 1 | 0.92% |
| 9000 CSE | 2,080 | 46 | 2.21% |
| 9000 CSE 3.0 V6 | 6 | 1 | 16.67% |
| 9000 CSE 3.0 V6 AUTO | 225 | 5 | 2.22% |
| 9000 CSE ANNIVERSARY | 1,612 | 307 | 19.04% |
| 9000 CSE AUTO | 360 | 6 | 1.67% |
| 9000 CSE T ANNIVERSARY | 141 | 30 | 21.28% |
| 9000 CSE T ANNIVERSARY AUTO | 199 | 41 | 20.60% |
| 9000 CSE TURBO | 5,032 | 241 | 4.79% |
| 9000 CSE TURBO AUTO | 3,100 | 185 | 5.97% |
| 9000 I | 8,350 | 26 | 0.31% |
| 9000 I 16 5D A | 2,056 | 3 | 0.15% |
| 9000 I AUTO | 101 | 2 | 1.98% |
| 9000 I SE | 263 | 4 | 1.52% |
| 9000 I SE AUTO | 187 | 2 | 1.07% |
| 9000 S | 3,219 | 13 | 0.40% |
| 9000 S AUTO | 1,160 | 7 | 0.60% |
| 9000 S TURBO | 491 | 3 | 0.61% |
| 9000 S TURBO AUTO | 117 | 1 | 0.85% |
| 9000 TURBO 16 5D A | 770 | 0 | 0.00% |
| 9000 TURBO 16 5D M | 3,931 | 24 | 0.61% |
| 9000 TURBO 16 SE | 319 | 4 | 1.25% |
| 9000 TURBO 16 SE AUTO | 1,362 | 5 | 0.37% |
| 9000 TURBO CD S | 156 | 1 | 0.64% |
| 9000 TURBO CD S AUTO | 46 | 0 | 0.00% |
| 9000 TURBO CS S | 785 | 5 | 0.64% |
| 9000 TURBO CS S AUTO | 235 | 4 | 1.70% |
| 9000 XS I | 745 | 5 | 0.67% |
| 9000 XS I AUTO | 219 | 1 | 0.46% |
Edited by Car_Nut on Monday 10th April 23:48
Funky Panda said:
I see the final 9000 CD turbo on a semi regular basis. Are the sample sizes here not really susceptible to incorrect registration by model type?
Top spotting! On your substantive point, while I think that we always need to be very cautious about small sample sizes. Given that, in general, these figures are the just the same sets of registration data rolled over from one year to another, through the road tax renewal process with which we are all familiar, I don't think that this applies here. The only times that records change is for the odd import and the odd bit of record correction. So I think that this table is valid. Indeed, even if one were to confine the analysis purely to the more numerous variants, we can still see enormous disparities, e.g. Turbo 16 SE Auto: 5 survivors out of peak post 1994 population of 1,362, c.f. CSE Anniversary 307 survivors out of a peak population of 1,612.
The other point that I should have made last night is that the survival rate is also influenced fairly clearly by the age range of the variant within the model's life span.
^ Perhaps your point might be made well with something not as populist as a Metro/Rover 100, but less rare than a Saab 9000 to avoid the perils of really small sample sizes?
(A Peugeot 406, for example? I imagine there are more 3.0 V6 coupés proportionally driving around than 1.9 diesel base models...)
(A Peugeot 406, for example? I imagine there are more 3.0 V6 coupés proportionally driving around than 1.9 diesel base models...)
blearyeyedboy said:
^ Perhaps your point might be made well with something not as populist as a Metro/Rover 100, but less rare than a Saab 9000 to avoid the perils of really small sample sizes?
(A Peugeot 406, for example? I imagine there are more 3.0 V6 coupés proportionally driving around than 1.9 diesel base models...)
Slightly perplexed as to how a Peugeot 406 would show better what a Saab 900 has already demonstrated. (A Peugeot 406, for example? I imagine there are more 3.0 V6 coupés proportionally driving around than 1.9 diesel base models...)
The Metro example curve was just to get a model's decay curve on one of the largest sample sizes possible, and thus a nice smooth curve, for something that is sure to have died, as they rotted like hell. Don't think that it would be really valid to look at survival of the more interesting variants, as I am sure that most MG Metro Turbos have run out of serviceable gearboxes by now.

Gassing Station | General Gassing | Top of Page | What's New | My Stuff