NEW Windows 64 bit AJP Diagnostic Software
Discussion


Great. I agree - reset adaptives will be a rare operation, but reset logged faults - maybe more often? And yes, RSAJP is a great app which does the same. Just trying to complete the functionality on this one. In any case - on the version you're using those functions do not work. The latest version should have fixed them. Ta.
notaping said:
Great. I agree - reset adaptives will be a rare operation, but reset logged faults - maybe more often? And yes, RSAJP is a great app which does the same. Just trying to complete the functionality on this one. In any case - on the version you're using those functions do not work. The latest version should have fixed them. Ta.
Good stuff - larger screen is always good anywayJust did a quick test over lunch, ignition on, but not on a running engine. Can report that the adaptive map screens now appear, but filled with zeros, I assume the engine needs to be running to populate?
I think I am right in thinking the statuses shown on the diagnostic screen are instantaneous ones? The reason I ask is that the WaterTemp, dspeed and WarmUpTimer all show as red (fault?) in this state. I loaded MBETool to cross check and that shows the instantaneous values for these as 'No Control' rather than as a fault, with logged faults indicated in a separate window - no faults indicated. Didn't have time to go through all options but is there a way to display logged faults?
Will test with engine running when I can, but more progress, well done
Adaptive map screens - if you engine hasn't been running for a while it's possible that the stored values have 'leaked' away. My car hibernates for winter and all its values have disappeared too. I double checked using the original TVR software on an old laptop. Check again after a few runs in the car. They should start filling up. Even bank first, then well down the line the odd bank starts populating. My car goes back on the road next month. I'll be checking the figures after a few runs. However - the example maps were recorded last year and use the same logic to read and display - so I've no reason to doubt that functionality.
The WaterTemp, dspeed and WarmUpTimer will display red until the engine is started. The red values in the Control area indicate 'No Control'. To save on real estate I'm just displaying the title of the parameter and changing the colour to indicate error. The MBE Tool displays a title and an adjacent value which is either 'Ok' or 'No Control'. On this app the text is just green or red. Means the same thing.
A logged fault turns the background colour red. If you don't have any red backgrounds - there are no logged faults.
Click the small engine icon at the right of the menu bar - this will bring up the user guide explaining the layout and colours. I have noted however, that for the Control area I said that red indicates a fault. As you've pointed out - it should really mean 'No Control'. I'll update the text, but it won't impact the functionality.
Great feedback. Thanks.
notaping said:
Adaptive map screens - if you engine hasn't been running for a while it's possible that the stored values have 'leaked' away. My car hibernates for winter and all its values have disappeared too. I double checked using the original TVR software on an old laptop. Check again after a few runs in the car. They should start filling up. Even bank first, then well down the line the odd bank starts populating. My car goes back on the road next month. I'll be checking the figures after a few runs. However - the example maps were recorded last year and use the same logic to read and display - so I've no reason to doubt that functionality.
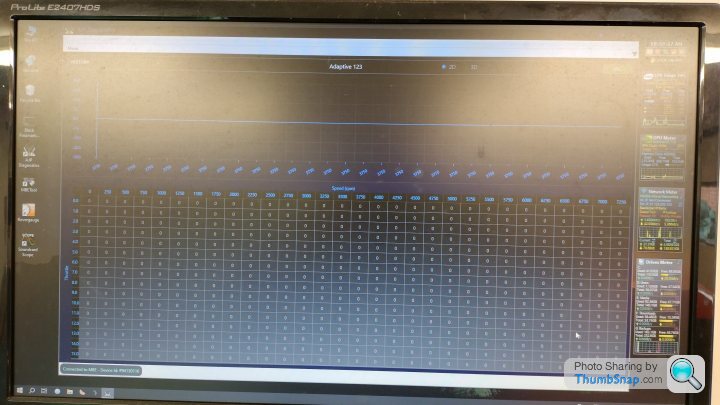
Just did a couple more screen shots to help debug. The first is the original TVR software (running in a VM) which displays the adaptive maps with the ignition on, but engine not running. The second shows the latest version of the AJP Diagnostic loaded a few minutes later which shows the same map displaying all zeros under the same conditions. Keep up the great work, getting very close!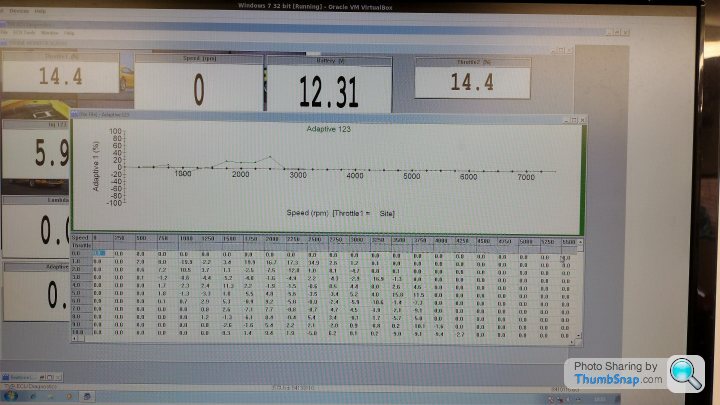
notaping said:
I changed the Dallas chip 4 or 5 years ago, but who knows - it might have been old stock. Maybe time to change again.
My understanding of the Dallas chip is that whilst the chip is on the shelf the battery is in a disconnect state and on first power up, a bridge is burnt for it to then work...that said, like other TVR items with 3V batteries... I believe that they will be the first point of failure IF you have a main 12V drain/flat battery/need to jump start etc. that if you simply turn the ignition on and the starter is looking for 12V and it does not get it, then the 3V in the Dallas will be a write off anyway. I use a Bluetooth battery monitor for all my car batteries these days to check the battery state prior to starting. (rather than leaving them on an Accumate, having added all the cars with sockets and two Accumate's across 10 cars). A@PS brilliant work...
Edited by Adrian@ on Friday 28th April 09:17
Thanks notapes for making this available to us and for all your time and effort you're putting into it.
I installed the latest(?, v1.0.8514.36104) version on an ebook running Windows 8.1 64bit.
It runs and connects to the MBE in my '03 T350c fine but unfortunately the values are not correct. See picture below (1st start at 20°C ambient, instrument cluster showed 12.2V).
As others have already reported the adaptives maps are all zero whereas the original software (shots of yellow cerb in the background) running on an old laptop with XP shows other than 0.
I noticed that the connection on the XP laptop was erratic and I had to reconnect using the menu without having to wiggle hardware connections whilst on the W8 notebook connection was (shown) as solid.
Perhaps this provides a hint of what might be going on.
Thanks in advance for pointers in the right direction if the cause lies in my setup.
Edited by hardtailer on Sunday 4th June 11:00
Edited by hardtailer on Sunday 4th June 11:01
Edited by hardtailer on Sunday 4th June 11:05
Edited by hardtailer on Sunday 4th June 11:08
Hardtailer, Thanks for trying the app and for your feedback.
Correct me if I'm wrong here, but I believe you might be in the Netherlands - and if so, this is almost certainly a problem with numeric punctuation. The range values for each ECU parameter are stored in a config file in "Program Files\KCC\AJP Diagnostics\Resources\Config" and for most parameters the value has a decimal "point". I think this is being interpreted as a thousand separator on your machine and throwing all the calculations out.
Unfortunately it's not just a simple case of swapping the punctuation in the config files because the values are comma separated and changing a point to a comma will mess up the parsing routine.
The quick and annoying fix for you is to change your computers locale to the UK while running the app. Not ideal, but it should work. Meanwhile I'll have a think about a more robust or configurable option. Unfortunately my time is very limited just now to work on the app, so I can't give any timescale for a fix.
The adaptives are a different problem which I think might be a timing issue (processor speed and MBE response times etc) - which is why it always works on my laptop because that's been used while testing. I know others have reported problems. I've included a configurable variable in the application config file - "C:\Program Files\KCC\AJP Diagnostics\AJPDiagnostics.exe.config". Look for <add key="AdaptiveDataReadWaitTime" value="200" /> - change the value to 300/400/500 etc. Or reduce the value - 50 etc. Basically - experiment and see what happens. You'll need to restart the app after changing the value.
The application tries to read the data from the MBE - if there's nothing in the input buffer it waits for a specific time, then tries to read the buffer again. It tries this a number of times before giving up and going back to reading the realtime engine parameters. This is why I'm hoping that adjusting the wait time might fix the issue.
If you get any success with this, please let me know. Also, if anyone else out there has managed to read adaptive values - would be good to know.
Cheers.
Update: changing the settings for decimal designation from comma to dot (in Windows settings) was the key to success.
Maps for %-correction of fuel quantity still show all zeros but it very probably is due to insufficient RAM in my ebook and subsequent time-outs or synch problems.
I will try the suggested changes to query duration next and report.
Thanks for your support notaping, much appreciated!
Maps for %-correction of fuel quantity still show all zeros but it very probably is due to insufficient RAM in my ebook and subsequent time-outs or synch problems.
I will try the suggested changes to query duration next and report.
Thanks for your support notaping, much appreciated!
Edited by hardtailer on Monday 19th June 11:14
hardtailer - That's good news the figures are now correct with the decimal point fix. Hope you get some use out of it.
I've had another look into the Adaptives problem. There's obviously a bigger problem than I initially thought. I've been playing around with the 'wait' numbers in the config file and have found that there is only a very narrow window where it works. This wasn't obvious from initial testing, but from the few feedback comments and some trials today I must admit - it is a bit flaky!
I've used the following values for the InterfaceWaitTime & the AdaptiveDataReadWaitTime . . .

I've found that ADRWT between 40 & 60 works best, any greater and the values tend to disappear? And if the IWT is too small the application seems to loose connection after reading the adaptive values.
Not good. Will delve back into the code to see what's going on.
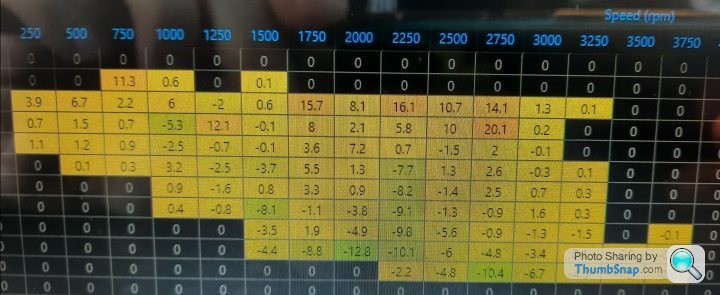
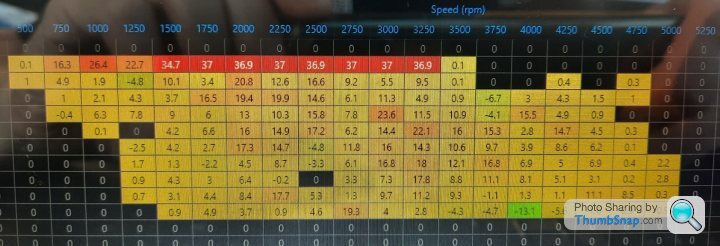
On the plus side - It does work if you find the correct values. I read these successfully today . .
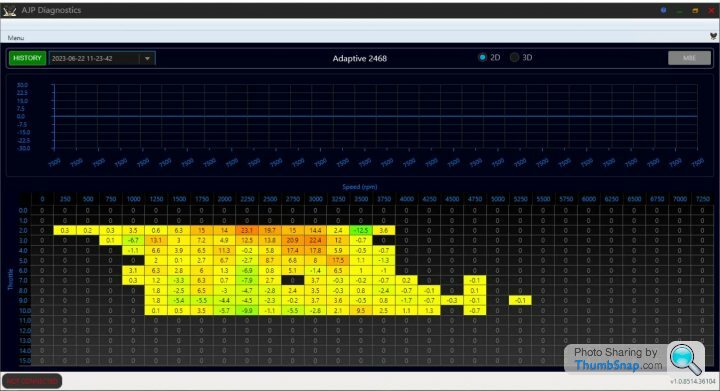
I'll keep plugging away . . .
I've had another look into the Adaptives problem. There's obviously a bigger problem than I initially thought. I've been playing around with the 'wait' numbers in the config file and have found that there is only a very narrow window where it works. This wasn't obvious from initial testing, but from the few feedback comments and some trials today I must admit - it is a bit flaky!
I've used the following values for the InterfaceWaitTime & the AdaptiveDataReadWaitTime . . .
I've found that ADRWT between 40 & 60 works best, any greater and the values tend to disappear? And if the IWT is too small the application seems to loose connection after reading the adaptive values.
Not good. Will delve back into the code to see what's going on.
On the plus side - It does work if you find the correct values. I read these successfully today . .
I'll keep plugging away . . .
Hardtailer, Glad you got it working. Unfortunately I can't help with interpreting the values. Mine's a V8, I know nothing about Sp6 setup - sorry. Perhaps there's someone out there with Sp6 tuning experience who can offer some advice on this.
I haven't come across a csv loading problem before. What are the symptoms? Do you get any error messages?
I haven't come across a csv loading problem before. What are the symptoms? Do you get any error messages?
Thanks for your response.
A 6 second long log file of 9kB works but any bigger or even a larger/longer log reduced to 9kB by deleting lines in Excel and saving as csv) won't load/display.
Also reducing number of logged channels didn't help.
I select a larger file, its name appears in the little window to the right of the green FILE button but nothing appears on the screen nor do I get the sand clock.
Task manager doesn’t show any greater RAM or cpu activity either and I don’t I notice any HD activity as if there's too little RAM available.
Edited by hardtailer on Thursday 6th July 19:58
Gassing Station | Cerbera | Top of Page | What's New | My Stuff