dyno dynamics shootout mode comparison
Discussion


On the suggestion of Mignon I've done a test of the various shooutout modes available on my analogue dyno dynamics 450.
The test car is a Tuscan 4 litre (the next car I had on the dyno) but with a temporary throttle stop fitted to limit the power .. a few reasons for doing it this way :
to limit any effects of wheel slip by limiting the absolute power
to reduce the heat build up on subsequent runs skewing the results
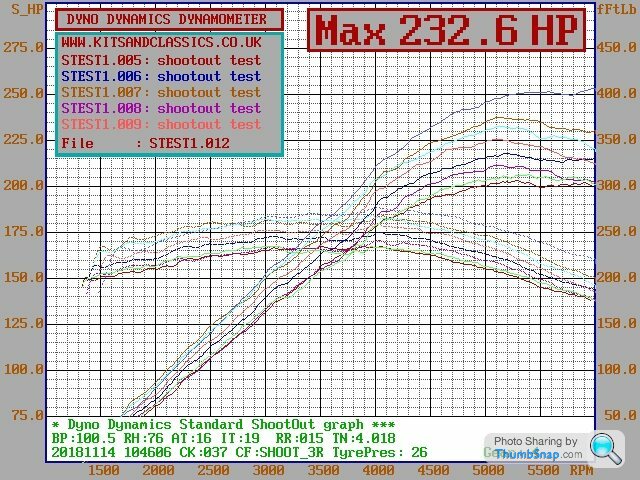
I'm really pleased I've done this test now as I am gobsmacked at the difference it makes running cars in different shooutout modes.. A total spread of 50hp from lowest to highest.
I've only included the guesstimated flywheel numbers as the shooutout mode has different corrections based on the in-built modelling of the shootout mode chosen, and this modelling is what we are looking at.
The car in question is an in line 6 cylinder car which in the S6 mode (shootout, 6 cylinder, normally aspirated) has made 218hp.
The colours are hard to pick out on the graph, so here are the peak hp numbers to help you separate out the various graphs.
the list is arranged as so : first the shootout mode, then the peak hp recorded (flywheel) then wheels hp. note these are the peak numbers only.
Normally aspirated shootout runs:
S4 203hp 169hp
S6 218hp 175hp
S8 237hp 187hp
Forced induction shootout runs:
S4f 211hp 176hp
S6f 225hp 182hp
S8f 253hp 195hp
Rotary engine modes:
S2r 206hp 172hp
S3r 232hp 188hp
Finally I did a run again in S4 to verify the car hadn't changed during the runs, it made 205hp so 2hp difference from where I first started.
Our poster in the other thread who's car was run in the wrong mode might be interested in the rotary result and how low it is.
Here's the graphs :
and power at wheels only :
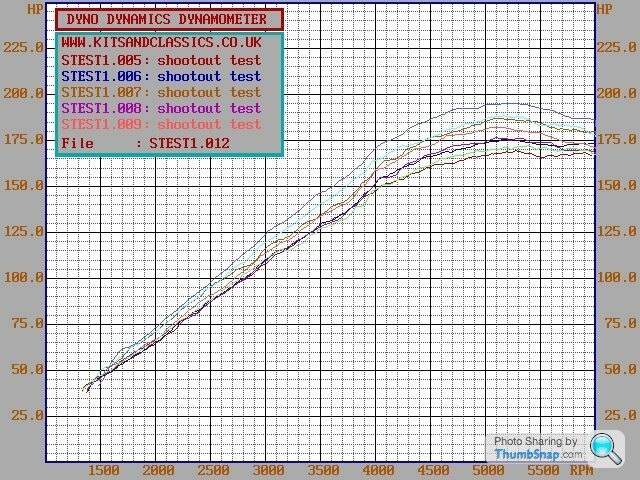
edited to add power at wheels info
The test car is a Tuscan 4 litre (the next car I had on the dyno) but with a temporary throttle stop fitted to limit the power .. a few reasons for doing it this way :
to limit any effects of wheel slip by limiting the absolute power
to reduce the heat build up on subsequent runs skewing the results
I'm really pleased I've done this test now as I am gobsmacked at the difference it makes running cars in different shooutout modes.. A total spread of 50hp from lowest to highest.
I've only included the guesstimated flywheel numbers as the shooutout mode has different corrections based on the in-built modelling of the shootout mode chosen, and this modelling is what we are looking at.
The car in question is an in line 6 cylinder car which in the S6 mode (shootout, 6 cylinder, normally aspirated) has made 218hp.
The colours are hard to pick out on the graph, so here are the peak hp numbers to help you separate out the various graphs.
the list is arranged as so : first the shootout mode, then the peak hp recorded (flywheel) then wheels hp. note these are the peak numbers only.
Normally aspirated shootout runs:
S4 203hp 169hp
S6 218hp 175hp
S8 237hp 187hp
Forced induction shootout runs:
S4f 211hp 176hp
S6f 225hp 182hp
S8f 253hp 195hp
Rotary engine modes:
S2r 206hp 172hp
S3r 232hp 188hp
Finally I did a run again in S4 to verify the car hadn't changed during the runs, it made 205hp so 2hp difference from where I first started.
Our poster in the other thread who's car was run in the wrong mode might be interested in the rotary result and how low it is.
Here's the graphs :
and power at wheels only :
edited to add power at wheels info
Edited by spitfire4v8 on Wednesday 14th November 11:57

Make of this what you will .. held at 4000rpm it showed 139hp at the wheels.
Just done a run with the shootout mode OFF and the ramp rate set at 12.5kmh/second which showed 177hp peak so very close to the 175hp peak of the S6 run (which is 12.5kmh/second accel rate also) in fact the runs were almost identical. So the shootout S6 run replicates a non shootout run at the same 125 ramp rate. You might reasonably expect that ..
But at 4000rpm on that run the hp is showing 150hp at the wheels, whereas in steady state it was 139hp at the wheels at the same point in the rev range,,
Is there some kind of modelling going on even during a power run to get the power at the wheels number during a power run then ?
Is there no true way to get a power at the wheels graph? The steady state power should be more than the same point in the rev range during a power run, because you're not losing power accelerating the wheels,tyres, drivetrain .. but I've just done a test which shows less power held at 4000rpm than during a power run ?? makes no sense at all to me unless I'm missing something (can't see the wood for the trees ?)
Where's Adrian ? (though it's the middle of the night in Australia so might have to wait a few hours before he sees the thread ..)
I'm going to do one more test .. one with the ramp rate at 10kmh/sec and one at 20kmh/sec in normal more (ie NOT shootout) and see how the results compare.
be right back.
Can you manually input a drivetrain inertia value?
I know on some dynos you can and it is useful to do when trying to get representative results from a sweep test.
The theory being conduct a steady state test as you have at 4k rpm.
Conduct sweep tests adjusting the inertia value so the sweep power at the static test site is the same.
A greater inertia value will give a higher result in a sweep test as the software thinks there is more work being done.
OP can you post the ramp rates for the respective shootout modes?
Edited by stevesingo on Wednesday 14th November 13:14
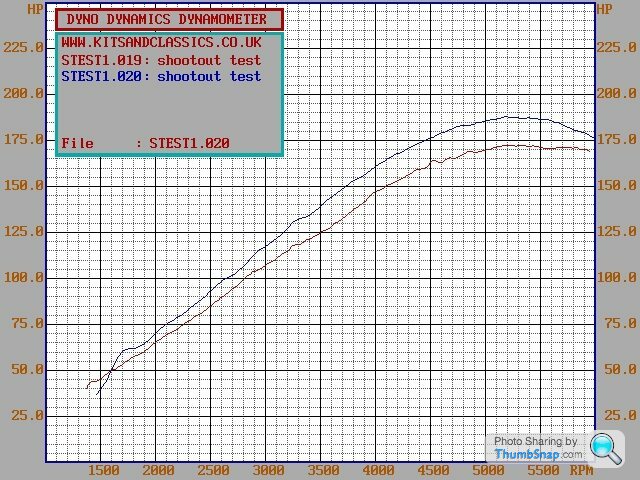
OK I'm back ..
in the following graph ive got power at the wheels
the lower red line is ramp rate 10kmh/sec
the upper blue line is 20kmh/sec
So the power at the wheels is more on a faster ramp rate. How can that be ? and even if there is some modelling of the recorded power, why isn't that modelling correcting both runs back to the same graph? The car is the same for both runs, but the faster ramp rate is showing more power at the wheels.
spitfire4v8 said:
OK I'm back ..
in the following graph ive got power at the wheels
the lower red line is ramp rate 10kmh/sec
the upper blue line is 20kmh/sec
So the power at the wheels is more on a faster ramp rate. How can that be ? and even if there is some modelling of the recorded power, why isn't that modelling correcting both runs back to the same graph? The car is the same for both runs, but the faster ramp rate is showing more power at the wheels.
Incorrect inertia value?in the following graph ive got power at the wheels
the lower red line is ramp rate 10kmh/sec
the upper blue line is 20kmh/sec
So the power at the wheels is more on a faster ramp rate. How can that be ? and even if there is some modelling of the recorded power, why isn't that modelling correcting both runs back to the same graph? The car is the same for both runs, but the faster ramp rate is showing more power at the wheels.
spitfire4v8 said:
Is there some kind of modelling going on even during a power run to get the power at the wheels number during a power run then
Yes absolutely. There is one set of modelling for inertia to get measured wheel power under accelerating conditions back to theoretical steady state wheel power and then a second set of modelling for losses to get theoretical steady state wheel power back up to theoretical steady state flywheel power. The maths is quite simple really.Edited by Mignon on Wednesday 14th November 13:32
stevesingo said:
Can you manually input a drivetrain inertia value?
I know on some dynos you can and it is useful to do when trying to get representative results from a sweep test.
The theory being conduct a steady state test as you have at 4k rpm.
Conduct sweep tests adjusting the inertia value so the sweep power at the static test site is the same.
A greater inertia value will give a higher result in a sweep test as the software thinks there is more work being done.
OP can you post the ramp rates for the respective shootout modes?
Yes you can input the drivetrain inertia and this seems to be the key to getting the wheels graph to mimic what would be the power at rpm intervals as tested in steady state. I know on some dynos you can and it is useful to do when trying to get representative results from a sweep test.
The theory being conduct a steady state test as you have at 4k rpm.
Conduct sweep tests adjusting the inertia value so the sweep power at the static test site is the same.
A greater inertia value will give a higher result in a sweep test as the software thinks there is more work being done.
OP can you post the ramp rates for the respective shootout modes?
Edited by stevesingo on Wednesday 14th November 13:14
I'm going to do some more tests ..
back already .. the ability to change the drivetrain inertia setting is locked out when in shootout mode so I can't test how it would affect the results of the different shootout modes, presumably because it's one of the key defining elements in the shootout modelling. Though this would allow the non shootout graphing to replicate the steady state numbers more closely
Edited by spitfire4v8 on Wednesday 14th November 13:38
Edited by spitfire4v8 on Wednesday 14th November 13:46
spitfire4v8 said:
Make of this what you will .. held at 4000rpm it showed 139hp at the wheels.
Just done a run with the shootout mode OFF and the ramp rate set at 12.5kmh/second which showed 177hp peak so very close to the 175hp peak of the S6 run (which is 12.5kmh/second accel rate also) in fact the runs were almost identical. So the shootout S6 run replicates a non shootout run at the same 125 ramp rate. You might reasonably expect that ..
Only if the inertia factor is the same in the shootout mode as you entered in the non shootout mode at the same ramp rate.Just done a run with the shootout mode OFF and the ramp rate set at 12.5kmh/second which showed 177hp peak so very close to the 175hp peak of the S6 run (which is 12.5kmh/second accel rate also) in fact the runs were almost identical. So the shootout S6 run replicates a non shootout run at the same 125 ramp rate. You might reasonably expect that ..
Mignon said:
Only if the inertia factor is the same in the shootout mode as you entered in the non shootout mode at the same ramp rate.
got ya. after reading the manual (!) I've seen that section. Never having done a power run* in anything other than shootout mode I'd not cottoned on to that bit. doh!- only ever used non shootout slower ramp rates during mapping.
All this does rather ask the question of the inertia rates and any other modelling in shootout mode being representative of the cars I'm running .. because if it was then surely the power at the wheels graphs should closely mimic the power at X rpm intervals when held in steady state.
Problem is, I and everyone else is using the same shootout modes, so whilst it's looking like we are (all? / sometimes? * delete as applicable) wrong, we are all wrong by the same amount.. ? And the only experience I have first hand of engine power on an engine dyno and the same engine in a car came out just over 10hp apart (just over 390hp on the engine dyno, 380hp installed in the car) so the end flywheel results are there or there-abouts, well in that sample of one anyway*
Problem is, I and everyone else is using the same shootout modes, so whilst it's looking like we are (all? / sometimes? * delete as applicable) wrong, we are all wrong by the same amount.. ? And the only experience I have first hand of engine power on an engine dyno and the same engine in a car came out just over 10hp apart (just over 390hp on the engine dyno, 380hp installed in the car) so the end flywheel results are there or there-abouts, well in that sample of one anyway*
- which, in the absence of any other data, I'm going to take as representative of every engine I've ever run

spitfire4v8 said:
159hp in steady state held at 5250rpm
Ok thanks. I think I have most of the information I need now to see what is going on. Can you alter the inertia value AFTER doing a run i.e. to regraph the wheel power curve under new assumptions or do you have to run the car on the rollers again?So here's the final set of tests which should establish if the dyno can even be used repeatably to get pseudo steady state figures. We know now that true steady state is 139 bhp at 4k rpm and 159 bhp at peak at about 5.3k rpm. If you use non shootout mode and keep reducing the inertia figure can you get a wheel power curve that matches those two points? If so you should then be able to alter the ramp rate at the same inertia value and this run should also come back to the same curve if the inertia calculations are correct. If the wheel power still varies with different ramp rates with the correct inertia value then the dyno can't really be used accurately other than in steady state mode.
What should happen at different ramp rates is the faster the engine accelerates the more power is consumed in accelerating the engine internals and other rotating components. The measured wheel power will therefore drop but the calculated steady state value should come back up to the same actual steady state if the inertia calcs are right.
Gassing Station | Engines & Drivetrain | Top of Page | What's New | My Stuff