Post your dyno curve here
Discussion


900T-R said:
ChimpOnGas said:
you just wait till I get it on liquid hydrogen injection to create the worlds first zero emissions full fat V8 TVR 
I told you I was different
I know a Belgian engineer (Olivier Vanhaelen) who got a Honda 1.6L VTEC engine to run on hydrogen at lambda=1 up to 4,500 or 5,000 (I forgot) rpm a few years ago usings some sort of pre-chamber design. Of course the goal was to achieve this for the entire rev range of the engine but I don't think he got there (yet). I told you I was different
Still, a lot better than the BMW and Mazda efforts, that achieved 2/3rds and half their engines' volumetric efficiency on hydrogen vs. petrol, respectively...
The challenge with this approach are the huge pressures involved, but it's all solvable.
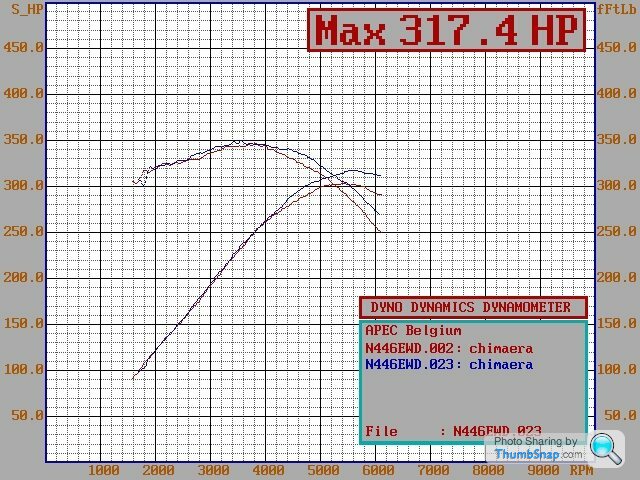
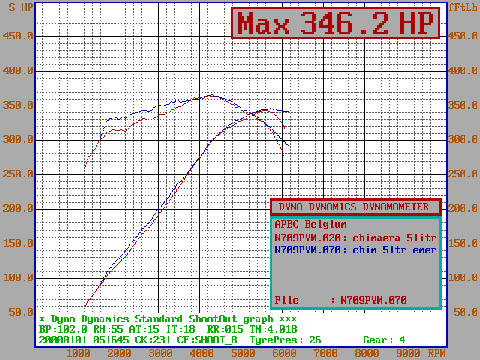
That’s another very nice curve. Lots of grunt then the extra hp of the 5.0 bigger heads and afm etc.
Very impressive.
This is very similar to mine, slightly more torque earlier and more hp at the top.
If we went on a drag strip not that I’ll be doing that but if we did, I’d likely control the grip off the line but you’d slowly over take me as the extra power takes its toll.
You’d be 1/2 a second faster if all went well.
I find these charts then the actual performance do match up.
Mines a 4.6 so exactly what you’d expect.
If I had bigger heads rather than standard Rover! There’s a good chance we’d be very close at the end,,, very exciting if your into racing lol.
My point is there’s a lot of questioning of Dyno accuracy and often pointed at Powers, totally out of order as they are often accurate and the cars speed proves it.
Mines got 299 hp and 345/350 torques as dynod on Dom’s machine.
Others with say 320 hp are just that touch faster. As the curves suggest.
Classic Chim said:
That’s another very nice curve. Lots of grunt then the extra hp of the 5.0 bigger heads and afm etc.
Very impressive.
This is very similar to mine, slightly more torque earlier and more hp at the top.
If we went on a drag strip not that I’ll be doing that but if we did, I’d likely control the grip off the line but you’d slowly over take me as the extra power takes its toll.
You’d be 1/2 a second faster if all went well.
I find these charts then the actual performance do match up.
Mines a 4.6 so exactly what you’d expect.
If I had bigger heads rather than standard Rover! There’s a good chance we’d be very close at the end,,, very exciting if your into racing lol.
My point is there’s a lot of questioning of Dyno accuracy and often pointed at Powers, totally out of order as they are often accurate and the cars speed proves it.
Mines got 299 hp and 345/350 torques as dynod on Dom’s machine.
Others with say 320 hp are just that touch faster. As the curves suggest.
I had an idling issue and the fuel was rich so took it to Jools.Very impressive.
This is very similar to mine, slightly more torque earlier and more hp at the top.
If we went on a drag strip not that I’ll be doing that but if we did, I’d likely control the grip off the line but you’d slowly over take me as the extra power takes its toll.
You’d be 1/2 a second faster if all went well.
I find these charts then the actual performance do match up.
Mines a 4.6 so exactly what you’d expect.
If I had bigger heads rather than standard Rover! There’s a good chance we’d be very close at the end,,, very exciting if your into racing lol.
My point is there’s a lot of questioning of Dyno accuracy and often pointed at Powers, totally out of order as they are often accurate and the cars speed proves it.
Mines got 299 hp and 345/350 torques as dynod on Dom’s machine.
Others with say 320 hp are just that touch faster. As the curves suggest.
Turned out that both Lamda sensors were goosed

HeWhoDaresRoy said:
Here's the one from my newly acquired 4.3
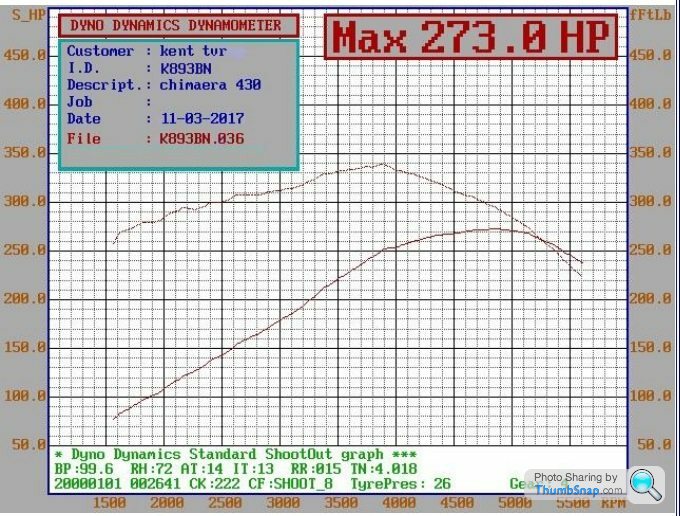
Without wishing to come across as trying to belittle your car - but the peak torque values seem extremely high in relation to either the associated power values, or the displacement...With a peak torque of just under 350lbft, this is almost equalling the reasonably-breathed-on 5l engines in the next 2 graphs - really..?!!
Dominic TVRetto said:
HeWhoDaresRoy said:
Here's the one from my newly acquired 4.3
Without wishing to come across as trying to belittle your car - but the peak torque values seem extremely high in relation to either the associated power values, or the displacement...With a peak torque of just under 350lbft, this is almost equalling the reasonably-breathed-on 5l engines in the next 2 graphs - really..?!!

The high torque can easily be explained by them not having a representative rpm correction.
The rpm on that graph is done using the rpm of the dyno rollers, and a rpm per mph conversion in the dyno, but it relies on you using a good rpm per mph number.
The peak bhp on a nice 4.3 isn't at 4800rpm, more like 5500rpm so if you take the 340lbft times 4800 divided by 5500 you get 297lb.ft. A much more believable number.
spitfire4v8 said:
The high torque can easily be explained by them not having a representative rpm correction.
The rpm on that graph is done using the rpm of the dyno rollers, and a rpm per mph conversion in the dyno, but it relies on you using a good rpm per mph number.
The peak bhp on a nice 4.3 isn't at 4800rpm, more like 5500rpm so if you take the 340lbft times 4800 divided by 5500 you get 297lb.ft. A much more believable number.
Nicely explained Joolz.The rpm on that graph is done using the rpm of the dyno rollers, and a rpm per mph conversion in the dyno, but it relies on you using a good rpm per mph number.
The peak bhp on a nice 4.3 isn't at 4800rpm, more like 5500rpm so if you take the 340lbft times 4800 divided by 5500 you get 297lb.ft. A much more believable number.
Do you recognise the graph, where it was done?

spitfire4v8 said:
The high torque can easily be explained by them not having a representative rpm correction.
The rpm on that graph is done using the rpm of the dyno rollers, and a rpm per mph conversion in the dyno, but it relies on you using a good rpm per mph number.
The peak bhp on a nice 4.3 isn't at 4800rpm, more like 5500rpm so if you take the 340lbft times 4800 divided by 5500 you get 297lb.ft. A much more believable number.
Right that's boggled my mind somewhat.....................and why I am coming to see you on Friday morning Joolz The rpm on that graph is done using the rpm of the dyno rollers, and a rpm per mph conversion in the dyno, but it relies on you using a good rpm per mph number.
The peak bhp on a nice 4.3 isn't at 4800rpm, more like 5500rpm so if you take the 340lbft times 4800 divided by 5500 you get 297lb.ft. A much more believable number.
spitfire4v8 said:
The high torque can easily be explained by them not having a representative rpm correction.
The rpm on that graph is done using the rpm of the dyno rollers, and a rpm per mph conversion in the dyno, but it relies on you using a good rpm per mph number.
The peak bhp on a nice 4.3 isn't at 4800rpm, more like 5500rpm so if you take the 340lbft times 4800 divided by 5500 you get 297lb.ft. A much more believable number.
or alternatively you could move the whole bhp curve up 700 rpm , which gives the pk of 250 bhp at 4600 = 285 lbs /ft . although that may no longer be the pk point with the bhp curve moved up 700... The rpm on that graph is done using the rpm of the dyno rollers, and a rpm per mph conversion in the dyno, but it relies on you using a good rpm per mph number.
The peak bhp on a nice 4.3 isn't at 4800rpm, more like 5500rpm so if you take the 340lbft times 4800 divided by 5500 you get 297lb.ft. A much more believable number.
ivanhoew said:
or alternatively you could move the whole bhp curve up 700 rpm , which gives the pk of 250 bhp at 4600 = 285 lbs /ft . although that may no longer be the pk point with the bhp curve moved up 700...
That doesn't work because the rpm is based on a ratio .. for instance if you moved the bit at 700rpm up 700 rpm you'd halve the torque reading, which obviously isn't right.Gassing Station | Chimaera | Top of Page | What's New | My Stuff