dyno dynamics shootout mode comparison
Discussion


On the suggestion of Mignon I've done a test of the various shooutout modes available on my analogue dyno dynamics 450.
The test car is a Tuscan 4 litre (the next car I had on the dyno) but with a temporary throttle stop fitted to limit the power .. a few reasons for doing it this way :
to limit any effects of wheel slip by limiting the absolute power
to reduce the heat build up on subsequent runs skewing the results
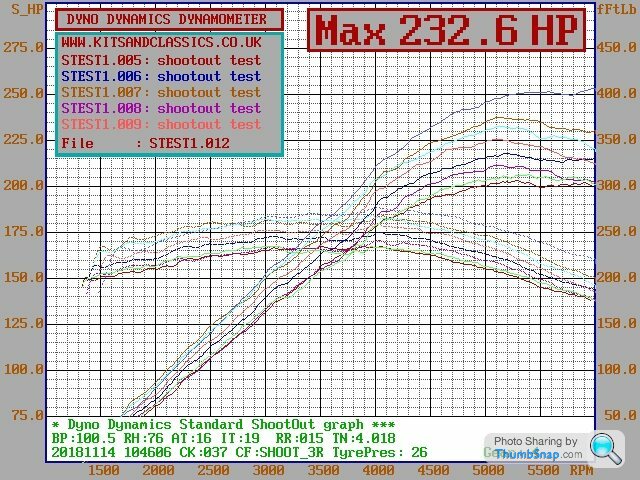
I'm really pleased I've done this test now as I am gobsmacked at the difference it makes running cars in different shooutout modes.. A total spread of 50hp from lowest to highest.
I've only included the guesstimated flywheel numbers as the shooutout mode has different corrections based on the in-built modelling of the shootout mode chosen, and this modelling is what we are looking at.
The car in question is an in line 6 cylinder car which in the S6 mode (shootout, 6 cylinder, normally aspirated) has made 218hp.
The colours are hard to pick out on the graph, so here are the peak hp numbers to help you separate out the various graphs.
the list is arranged as so : first the shootout mode, then the peak hp recorded (flywheel) then wheels hp. note these are the peak numbers only.
Normally aspirated shootout runs:
S4 203hp 169hp
S6 218hp 175hp
S8 237hp 187hp
Forced induction shootout runs:
S4f 211hp 176hp
S6f 225hp 182hp
S8f 253hp 195hp
Rotary engine modes:
S2r 206hp 172hp
S3r 232hp 188hp
Finally I did a run again in S4 to verify the car hadn't changed during the runs, it made 205hp so 2hp difference from where I first started.
Our poster in the other thread who's car was run in the wrong mode might be interested in the rotary result and how low it is.
Here's the graphs :
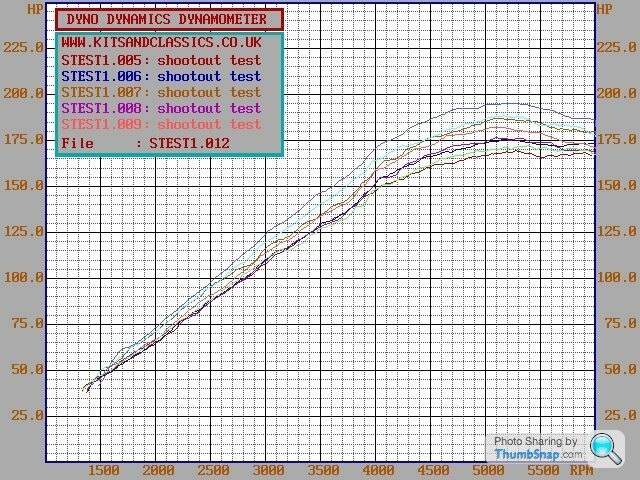
and power at wheels only :
edited to add power at wheels info
The test car is a Tuscan 4 litre (the next car I had on the dyno) but with a temporary throttle stop fitted to limit the power .. a few reasons for doing it this way :
to limit any effects of wheel slip by limiting the absolute power
to reduce the heat build up on subsequent runs skewing the results
I'm really pleased I've done this test now as I am gobsmacked at the difference it makes running cars in different shooutout modes.. A total spread of 50hp from lowest to highest.
I've only included the guesstimated flywheel numbers as the shooutout mode has different corrections based on the in-built modelling of the shootout mode chosen, and this modelling is what we are looking at.
The car in question is an in line 6 cylinder car which in the S6 mode (shootout, 6 cylinder, normally aspirated) has made 218hp.
The colours are hard to pick out on the graph, so here are the peak hp numbers to help you separate out the various graphs.
the list is arranged as so : first the shootout mode, then the peak hp recorded (flywheel) then wheels hp. note these are the peak numbers only.
Normally aspirated shootout runs:
S4 203hp 169hp
S6 218hp 175hp
S8 237hp 187hp
Forced induction shootout runs:
S4f 211hp 176hp
S6f 225hp 182hp
S8f 253hp 195hp
Rotary engine modes:
S2r 206hp 172hp
S3r 232hp 188hp
Finally I did a run again in S4 to verify the car hadn't changed during the runs, it made 205hp so 2hp difference from where I first started.
Our poster in the other thread who's car was run in the wrong mode might be interested in the rotary result and how low it is.
Here's the graphs :
and power at wheels only :
edited to add power at wheels info
Edited by spitfire4v8 on Wednesday 14th November 11:57
Make of this what you will .. held at 4000rpm it showed 139hp at the wheels.
Just done a run with the shootout mode OFF and the ramp rate set at 12.5kmh/second which showed 177hp peak so very close to the 175hp peak of the S6 run (which is 12.5kmh/second accel rate also) in fact the runs were almost identical. So the shootout S6 run replicates a non shootout run at the same 125 ramp rate. You might reasonably expect that ..
But at 4000rpm on that run the hp is showing 150hp at the wheels, whereas in steady state it was 139hp at the wheels at the same point in the rev range,,
Is there some kind of modelling going on even during a power run to get the power at the wheels number during a power run then ?
Is there no true way to get a power at the wheels graph? The steady state power should be more than the same point in the rev range during a power run, because you're not losing power accelerating the wheels,tyres, drivetrain .. but I've just done a test which shows less power held at 4000rpm than during a power run ?? makes no sense at all to me unless I'm missing something (can't see the wood for the trees ?)
Where's Adrian ? (though it's the middle of the night in Australia so might have to wait a few hours before he sees the thread ..)
I'm going to do one more test .. one with the ramp rate at 10kmh/sec and one at 20kmh/sec in normal more (ie NOT shootout) and see how the results compare.
be right back.
OK I'm back ..
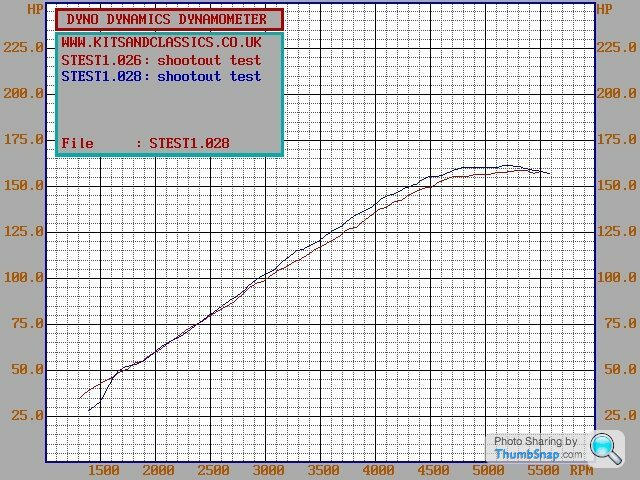
in the following graph ive got power at the wheels
the lower red line is ramp rate 10kmh/sec
the upper blue line is 20kmh/sec
So the power at the wheels is more on a faster ramp rate. How can that be ? and even if there is some modelling of the recorded power, why isn't that modelling correcting both runs back to the same graph? The car is the same for both runs, but the faster ramp rate is showing more power at the wheels.
stevesingo said:
Can you manually input a drivetrain inertia value?
I know on some dynos you can and it is useful to do when trying to get representative results from a sweep test.
The theory being conduct a steady state test as you have at 4k rpm.
Conduct sweep tests adjusting the inertia value so the sweep power at the static test site is the same.
A greater inertia value will give a higher result in a sweep test as the software thinks there is more work being done.
OP can you post the ramp rates for the respective shootout modes?
Yes you can input the drivetrain inertia and this seems to be the key to getting the wheels graph to mimic what would be the power at rpm intervals as tested in steady state. I know on some dynos you can and it is useful to do when trying to get representative results from a sweep test.
The theory being conduct a steady state test as you have at 4k rpm.
Conduct sweep tests adjusting the inertia value so the sweep power at the static test site is the same.
A greater inertia value will give a higher result in a sweep test as the software thinks there is more work being done.
OP can you post the ramp rates for the respective shootout modes?
Edited by stevesingo on Wednesday 14th November 13:14
I'm going to do some more tests ..
back already .. the ability to change the drivetrain inertia setting is locked out when in shootout mode so I can't test how it would affect the results of the different shootout modes, presumably because it's one of the key defining elements in the shootout modelling. Though this would allow the non shootout graphing to replicate the steady state numbers more closely
Edited by spitfire4v8 on Wednesday 14th November 13:38
Edited by spitfire4v8 on Wednesday 14th November 13:46
Mignon said:
Only if the inertia factor is the same in the shootout mode as you entered in the non shootout mode at the same ramp rate.
got ya. after reading the manual (!) I've seen that section. Never having done a power run* in anything other than shootout mode I'd not cottoned on to that bit. doh!- only ever used non shootout slower ramp rates during mapping.
All this does rather ask the question of the inertia rates and any other modelling in shootout mode being representative of the cars I'm running .. because if it was then surely the power at the wheels graphs should closely mimic the power at X rpm intervals when held in steady state.
Problem is, I and everyone else is using the same shootout modes, so whilst it's looking like we are (all? / sometimes? * delete as applicable) wrong, we are all wrong by the same amount.. ? And the only experience I have first hand of engine power on an engine dyno and the same engine in a car came out just over 10hp apart (just over 390hp on the engine dyno, 380hp installed in the car) so the end flywheel results are there or there-abouts, well in that sample of one anyway*
Problem is, I and everyone else is using the same shootout modes, so whilst it's looking like we are (all? / sometimes? * delete as applicable) wrong, we are all wrong by the same amount.. ? And the only experience I have first hand of engine power on an engine dyno and the same engine in a car came out just over 10hp apart (just over 390hp on the engine dyno, 380hp installed in the car) so the end flywheel results are there or there-abouts, well in that sample of one anyway*
- which, in the absence of any other data, I'm going to take as representative of every engine I've ever run

Stan Weiss said:
Is there any way to get a look at the raw data that is measured before the software does its thing? Maybe exporting to a CSV file. For the 2 runs at different ramp rates.
Stan
Not as far as I'm aware. I can look at the data but it just looks like the data that's used to generate the graphs .. as looking at graphs 19 and 20 at 2500rpm there's 8 hp between them which is exactly what we have on the difference between the two runs on the graph.Stan
To be honest I've never looked into this in this way before so showing my ignorance of how my own dyno collects / stores its information. It also runs in DOS and delving into the bowels of the system puts the fear of God in me*
- other deities are available
Edited by spitfire4v8 on Wednesday 14th November 14:11
Mignon said:
So here's the final set of tests which should establish if the dyno can even be used repeatably to get pseudo steady state figures. We know now that true steady state is 139 bhp at 4k rpm and 159 bhp at peak at about 5.3k rpm. If you use non shootout mode and keep reducing the inertia figure can you get a wheel power curve that matches those two points? If so you should then be able to alter the ramp rate at the same inertia value and this run should also come back to the same curve if the inertia calculations are correct. If the wheel power still varies with different ramp rates with the correct inertia value then the dyno can't really be used accurately other than in steady state mode.
What should happen at different ramp rates is the faster the engine accelerates the more power is consumed in accelerating the engine internals and other rotating components. The measured wheel power will therefore drop but the calculated steady state value should come back up to the same actual steady state if the inertia calcs are right.
Well the answer is yes and no.What should happen at different ramp rates is the faster the engine accelerates the more power is consumed in accelerating the engine internals and other rotating components. The measured wheel power will therefore drop but the calculated steady state value should come back up to the same actual steady state if the inertia calcs are right.
I've managed to get an inertia value which is very good on a ramp rate of 10kmh/sec but on the faster 20kmh/sec rate the power is too high.
I can massage the inertia value higher and get a good correlation at lower revs, but at higher revs they drift apart again, and the 10kmh/sec ramp rate is also now too high by a couple of hp.
first graph is lower inertia value .. the red line mirrors the steady state values very well, but the higher blue line is quite a way off.
second graph is with the inertia value massaged higher .. the two graphs are both now higher than the steady state values, but they at least follow each other to just over 3000rpm.

PeterBurgess said:
Don't get bogged down. At the end of the day, if you run like for like cars in the same mode you are using the tool correctly. It doesn't matter if the reading is in kidney beans, matchsticks or jelly babies as long as you keep it all working the same and calibrate the pau now and then all will be fine. At the end of the day you are tuning folks cars ( and there is a lot of testament to your good work) and trying to make them run the best you can. You are not MIRA researching. I think the only thing I would do as an extra is a coastdown test just to see if the figures are near enough the same as for other like cars and if not why not. Bob's your Uncle and Fanny's your Aunt!
Yes I will continue to use the shootout mode as I think it should be used, bearing in mind this will/should be how the same car would be tested by another operator on another DD dyno .. so we are all singing from the same sheet, so to speak.It's been a fascinating day of playing though. Every day's a school day!
It would be great to have both an engine dyno and a chassis dyno and spend my life testing lots of different types of engine .. sadly earning a meagre living gets in the way.
Mignon said:
So it would seem that sadly the inertia calculation is not being done correctly. As I explained above, part of it needs to be done at engine speed and part at wheel speed and I guess they didn't go into it in that amount of detail.
It would appear so .. unless I've missed some other setting I can adjust.Interestingly though .. even allowing for the fact that we now believe perhaps some of the modelling to be flawed, when I test a good healthy car* in shootout mode the flywheel torque/litre values are very believable, and the horsepower values also seem representative
- caveat to that is that I tend to run very similar cars which are mostly in the 200 to 400hp range. I don't see for example Citroen 2CV or 1000hp Skylines.
Mignon said:
spitfire4v8 said:
S4 203hp 169hp
S6 218hp 175hp
S8 237hp 187hp
Forced induction shootout runs:
S4f 211hp 176hp
S6f 225hp 182hp
S8f 253hp 195hp
Rotary engine modes:
S2r 206hp 172hp
S3r 232hp 188hp
I find it interesting that in the lowest engine config of each band (S4, S4F, S2r) they're using exactly the same transmission loss equations as me (wheel bhp + 10)/ 0.88S6 218hp 175hp
S8 237hp 187hp
Forced induction shootout runs:
S4f 211hp 176hp
S6f 225hp 182hp
S8f 253hp 195hp
Rotary engine modes:
S2r 206hp 172hp
S3r 232hp 188hp
S4 (169 + 10) / 0.88 = 203
S4F (176 + 10) / 0.88 = 211
S2r (172 + 10) / 0.88 = 207
After that it clearly goes nuts for 6 and 8 pots e.g. S8 (187 + 10) / 0.88 = 224 not 237
If anyone ever comments that the power graph I've given them is too high I now know what to do about it (that's never going happen, is it?!)
PeterBurgess said:
I think the engine dyno would open another can of worms, I am sure we can do some work with you once the SF dyno is running. Already I know the inertia effect will show different power readings depending on the acceleration rate....sounds familiar  Just says do all runs same to get comparisons. We have started to build a donkey B engine for dyno. Need to sort emergency shutting for air extractor ports, safety to sides of cell to take any impact, sort out fuelling, fill water tank even more ( only had a few hundred gallons in for testing pump and return pump).
If you drop in for a cuppa I will take you to the dyno unit so you can have a look.
My work often drops off towards winter (seasonal sports car work) so I will definitely make time to come over, cheers. Just says do all runs same to get comparisons. We have started to build a donkey B engine for dyno. Need to sort emergency shutting for air extractor ports, safety to sides of cell to take any impact, sort out fuelling, fill water tank even more ( only had a few hundred gallons in for testing pump and return pump).If you drop in for a cuppa I will take you to the dyno unit so you can have a look.
Mignon said:
Well, they're not outside the maxima I suggest are possible but those are hard to achieve and most engines don't come anywhere near them. You've been seeing 80 ft lbs per litre from the 2v TVR V8s you've been running but mid 70s is more normal from what is let's be honest were not very inspiring engines with lower than ideal cranking pressures. For 4v engines mid to high 80s is hard to beat. 93 is top of the tree with every damn thing perfect. I know what the pre turbo F1 engines produced because I have a friend who works in F1 but obviously I can't say the numbers. There's a lot of real data out there now on the old Cosworth DFV and its later variants and that would just make 93 ft lbs per litre from a really good one. What's laughable is the people out there claiming 96, 97 even 100 ft lbs per litre from modified 4v road engines like Ford Zetecs and Peugeot 106s which they're convinced is because they're tuning gods.
So let's just say it's not over-reading by so much as to be completely unbelievable unlike say 156 ft lbs at the WHEELS from a 1.9 litre MGB engine which at 82 ft lbs per litre at the wheels is clearly fantasy land.
My favourite type of roller for most closely matching real engine dyno numbers is the Dastek. Every other type of roller reads higher in my experience.
Yes the TVR versions of the Rover V8 are in the right area .. typically around 240/250lb.ft for the 4 litre engines (60lb.ft/litre or just over) and I think (off the top of my head) the best 5 litre version made 370lb.ft (74lb.ft/litre) from a V8 Developments build. So let's just say it's not over-reading by so much as to be completely unbelievable unlike say 156 ft lbs at the WHEELS from a 1.9 litre MGB engine which at 82 ft lbs per litre at the wheels is clearly fantasy land.
My favourite type of roller for most closely matching real engine dyno numbers is the Dastek. Every other type of roller reads higher in my experience.
The TVR AJP8 (their own V8 engine) I typically see 320lb.ft from the 4.2 version (76/litre) and 340/350lb.ft from the larger 4.5 ( so again around 76/litre) and a little bit more from the higher compression "red rose" factory versions.
the bigger aftermarket 4.7s and 4.8s make 375/380 so nudging the high numbers there at 78to79/litre - such as the engine in my "cam timing and induction lengths" thread so maybe there's a trend to inflated numbers on the more powerful variants, but not a million miles away for the vast majority of the rest of them.
What's more though is that these numbers are relatively consistent when I see these cars back in for other work, which is obviously a very important point, absolute numbers aside.
Thanks for your input everyone.
Hi
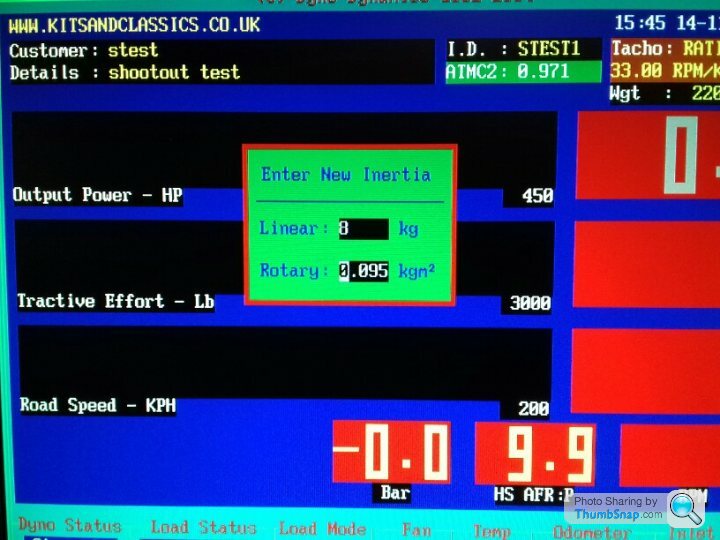
I don't know what the inertia setting is in the shootout mode, when I click on the change inertia button it says feature locked, and no values are given.
Out of shootout it defaults to this box:
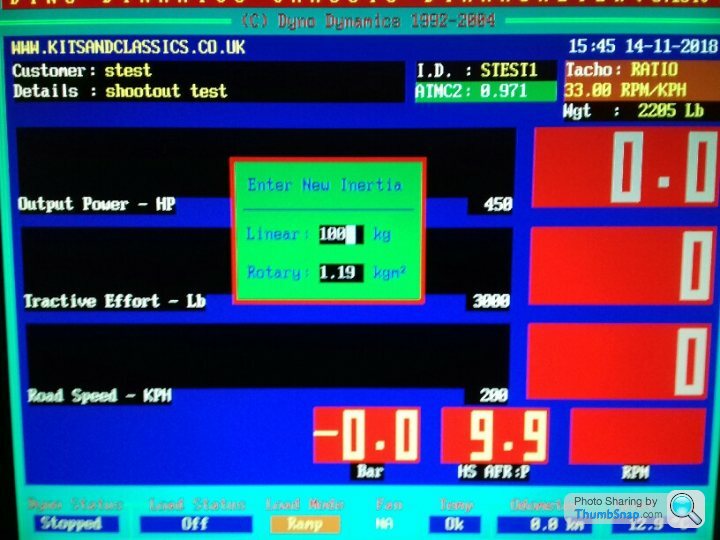
but to get the more representative numbers I used a value of 8 :
and to get the graphs where the two lines were overlapping up to 3200rpm I used 15 :
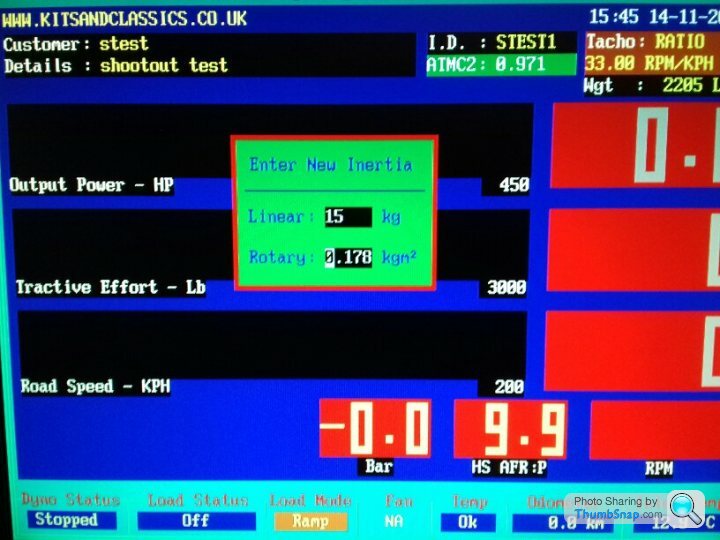
note that both 8 and 15 are a lot less than the default of 100, and the effect of such a change is slight. To begin with I tried going from 100 to 75, then to 60, and could see no real change in the graphs, hence going all the way down to single figures, where it did show a real change in the measured hp.
As an accomplished mathematician maybe you can see some significance in these numbers, or why I've had to make such a massive change to the absolute values to make a discernible change on the graphs.
I don't know what the inertia setting is in the shootout mode, when I click on the change inertia button it says feature locked, and no values are given.
Out of shootout it defaults to this box:
but to get the more representative numbers I used a value of 8 :
and to get the graphs where the two lines were overlapping up to 3200rpm I used 15 :
note that both 8 and 15 are a lot less than the default of 100, and the effect of such a change is slight. To begin with I tried going from 100 to 75, then to 60, and could see no real change in the graphs, hence going all the way down to single figures, where it did show a real change in the measured hp.
As an accomplished mathematician maybe you can see some significance in these numbers, or why I've had to make such a massive change to the absolute values to make a discernible change on the graphs.
Edited by spitfire4v8 on Wednesday 14th November 16:28
Yes, I might inadvertantly have compromised my own test right there. Sadly the test car is now off the dyno, and destined for another engine (it's actually my own car that I've used, but it has had a water consumption issue ever since I bought it a year ago so I've got another engine to go in to get me out of trouble in the short term*).
The next car on the dyno is a home-modified triumph stag.
I may well return to this at some point though and if I do I will most certainly put any new data up on here.
The next car on the dyno is a home-modified triumph stag.
I may well return to this at some point though and if I do I will most certainly put any new data up on here.
- by short term i mean it'll still probably be on the interim engine in 5 years time! Too many projects, too much time spent testing data on the dyno and posting on forums but it's been a nice distraction for a day
Mignon said:
It appears you change the linear box only and it recalculates the rotary but linear ought to be wheel and tyre mass and this should be independent from rotary. I would suggest a value of 60 kg for linear if you can get it to accept this on its own along with the rotary values I suggest above. The manual must explain surely?
You can only input one field and the other field auto fills. You can't input your own separate values for rotary and linear.The manual has this to say :
"Dyno now uses linear inertia rather than previous rotary inertia equivalent".
The section on inertia values is very short, really only around 15 lines within 200plus A4 pages but does indeed describe the proceedure of massaging the inertia value until the power run graph closely relates to the power values when held in steady state. It gives no guide as to what values might be suitable, so why it defaults to 100 when suitable values seem to be in single figures I don't know. It just goes on to say that larger inertia numbers make a higher power graph.
It also mentions that the shootout mode is more about repeatability of results across numerous operators / garages rather than technical accuracy. As the shootout mode is designed for the power graph / rolling road day market where people are going to compare their runs with others then I guess that makes sense by locking out certain features so they can't be tampered with .. but I don't see why repeatability and technical accuracy are seemingly considered exclusive from each other. Make it technically accurate then the repeatability follows.
Suffice it to say, despite everything that's cropped up within this thread (some of it my ignorance), I still think the dyno dynamics rolling road gives believable shootout run power graph results (i.e not pie in the sky like some dynos, albeit higher than mignon's formula suggests), however the dyno might be going about it behind the scenes.
One final point..
The other issue is that of the repeatability as mentioned in the shootout section of the manual .. I and everyone else has been using the same shootout tests for decades, so we must keep using it to ensure validity of comparison over the years, but again - absolute values aside.
I've got to earn some money today!
The irony is that one of the reasons I chose to go with dyno dynamics over a decade ago is that in the industry it's generally regarded as a pessimistic dyno! I like the fact that if I say a car's got 400hp if that same car gets run elsewhere they'll probably get a graph with higher power on it. Customers generally like that. If I said it was 450hp, then they run it and get a graph with 400hp on it, they'd be back demanding to know why!
I have limited experience of dastek, but I think my tuscan race car (5 litre rover v8) may have been on one before I owned it. I will try and find the graph to compare if it was dastek.
I have limited experience of dastek, but I think my tuscan race car (5 litre rover v8) may have been on one before I owned it. I will try and find the graph to compare if it was dastek.
Gassing Station | Engines & Drivetrain | Top of Page | What's New | My Stuff