Medieval Warm period due to NAO
Discussion


MWP and solar correlation not killed by NAO - see my first two posts in this thread - as solar activity is linked to NAO cycling. Curiously that got missed somehow.
In addition, modern day solar to climate links are not lost either, since the temperature plot that gets used for this purpose has more rapid warming than actually existed, because the surface gridded data used for such plots is contaminated by non-climatic signals so that the warming is exaggerated by ~ 100% (McKitrick & Michaels 2007). In addition the solar-to-climate lag time of ~ 8 years is not taken into account when such issues are discussed in pro-manmade warming contexts. The period in question is the ~30 years to 2002.
Also note here in Dr Roy Spencer's testimony to the USA House of Representatives, p4 & p5, contains MWP data worth a look, showing global temperature then greater than today, entirely naturally:
http://oversight.house.gov/documents/2007032015233...
On Saturday I said:
There's a new paper from Eichler et. al., in Geophysical Research Letters (2009) looking at temperature reconstructions for a period starting in 1250 which is at the heart of the Medieval Warm Period. they state:
Spectral analysis of the Belukha temperature reconstruction shows significant periods at 205, 86, and 10.8 years, which can be related to the solar Suess, Gleissberg, and Schwabe cycles, respectively. The 8.3 and 2.3 periodicities are typical of the North Atlantic Oscillation (NAO) index [e.g., Cook et. al., 1998; Garcýa et. al., 2005], whereas the 5.2 year cycle is observed in both, solar and NAO data series.
Any research using only sunspot number will miss eruptivity aspects of solar forcing e.g. magnetic effects operating on cosmic ray flux and the auroral oval, which can emanate from coronal holes as well as active sunspot groups, so any science looking at sunspot numbers alone is incomplete and conclusions drawn will be insecure.Spectral analysis of the Belukha temperature reconstruction shows significant periods at 205, 86, and 10.8 years, which can be related to the solar Suess, Gleissberg, and Schwabe cycles, respectively. The 8.3 and 2.3 periodicities are typical of the North Atlantic Oscillation (NAO) index [e.g., Cook et. al., 1998; Garcýa et. al., 2005], whereas the 5.2 year cycle is observed in both, solar and NAO data series.
In addition, modern day solar to climate links are not lost either, since the temperature plot that gets used for this purpose has more rapid warming than actually existed, because the surface gridded data used for such plots is contaminated by non-climatic signals so that the warming is exaggerated by ~ 100% (McKitrick & Michaels 2007). In addition the solar-to-climate lag time of ~ 8 years is not taken into account when such issues are discussed in pro-manmade warming contexts. The period in question is the ~30 years to 2002.
Also note here in Dr Roy Spencer's testimony to the USA House of Representatives, p4 & p5, contains MWP data worth a look, showing global temperature then greater than today, entirely naturally:
http://oversight.house.gov/documents/2007032015233...
Thanks Tom, I wish I could accept your congratulations, but I wasn't trying to call anyone a tosser. Sorry if I was a bit abrupt and lacking in tact.
The article has been quoted with such spin on the sceptic/denier sites, that it gives the impression that global warming has been explained rather than the trends in global temperature. This may create such an expectation in the casual reader that they don't pick up on the "trend" idea.
It's a mistake that is easy enough to make, so I didn't mean to insult anyone.
turbobloke said:
On Saturday I said:
T they state:
Spectral analysis of the Belukha temperature reconstruction shows significant periods at 205, 86, and 10.8 years, which can be related to the solar Suess, Gleissberg, and Schwabe cycles, respectively. The 8.3 and 2.3 periodicities are typical of the North Atlantic Oscillation (NAO) index [e.g., Cook et. al., 1998; Garcýa et. al., 2005], whereas the 5.2 year cycle is observed in both, solar and NAO data series.
Spectral analysis of the Belukha temperature reconstruction shows significant periods at 205, 86, and 10.8 years, which can be related to the solar Suess, Gleissberg, and Schwabe cycles, respectively. The 8.3 and 2.3 periodicities are typical of the North Atlantic Oscillation (NAO) index [e.g., Cook et. al., 1998; Garcýa et. al., 2005], whereas the 5.2 year cycle is observed in both, solar and NAO data series.
"Our reconstructed temperatures are significantly correlated with the 10Be and 14C based solar activity reconstructions in the period 1250-1850, but not with the greenhouse gas CO2 (Figure 2b). This indicates that solar activity changes are a main driver for the temperature variation in the Altai region during the pre industrial time. However, during the industrial period (1850-2000) solar forcing became less important and only the CO2 concentrations show a significant correlation with the temperature record. Our results are in agreement with studies based on NH temperature reconstructions [Scafetta et al., 2007] revealing that only up to approximately 50% of the observed global warming in the last 100 years can be explained by the Sun."
So you quote a paper that specifically denies the Solar/CRF/AGW link to support your case. Interesting technique, but I don't really think that it will catch on.
A new paper has been published in GRL (2009) by Scafetta and Willson entitled: ‘ACRIM-gap and TSI trend issue resolved using a surface magnetic flux TSI proxy model’
The Abstract states:
“The ACRIM-gap (1989.5-1991.75) continuity dilemma for satellite TSI observations is resolved by bridging the satellite TSI monitoring gap between ACRIM1 and ACRIM2 results with TSI derived from Krivova et al.’s (2007) proxy model based on variations of the surface distribution of solar magnetic flux. ‘Mixed’ versions of ACRIM and PMOD TSI composites are constructed with their composites’ original values except for the ACRIM gap, where Krivova modeled TSI is used to connect ACRIM1 and ACRIM2 results. Both ‘mixed’ composites demonstrate a significant TSI increase of 0.033%/decade between the solar activity minima of 1986 and 1996, comparable to the 0.037% found in the ACRIM composite. The finding supports the contention of Willson (1997) that the ERBS/ERBE results are flawed by uncorrected degradation during the ACRIM gap and refutes the Nimbus7/ERB ACRIM gap adjustment Fröhlich and Lean (1998) employed in constructing the PMOD.”
The authors state in their conclusions that:
“This finding has evident repercussions for climate change and solar physics. Increasing TSI between 1980 and 2000 could have contributed significantly to global warming during the last three decades [Scafetta and West, 2007, 2008]. Current climate models [Intergovernmental Panel on Climate Change, 2007] have assumed that the TSI did not vary significantly during the last 30 years and have therefore underestimated the solar contribution and overestimated the anthropogenic contribution to global warming.”
Keywords
Nir Shaviv’s latest paper has been published in the Journal of Geophysical Research (Space Physics, 2008)). It is entitled: ‘Using the oceans as a calorimeter to quantify the solar radiative forcing.’ The Abstract states:
Over the 11-year solar cycle, small changes in the total solar irradiance (TSI) give rise to small variations in the global energy budget. It was suggested, however, that different mechanisms could amplify solar activity variations to give large climatic effects, a possibility which is still a subject of debate. With this in mind, we use the oceans as a calorimeter to measure the radiative forcing variations associated with the solar cycle. This is achieved through the study of three independent records, the net heat flux into the oceans over 5 decades, the sea-level change rate based on tide gauge records over the 20th century, and the sea-surface temperature variations. Each of the records can be used to consistently derive the same oceanic heat flux. We find that the total radiative forcing associated with solar cycles variations is about 5 to 7 times larger than just those associated with the TSI variations, thus implying the necessary existence of an amplification mechanism, although without pointing to which one.
The paper concludes:
In summary, we find clear evidence indicating that the total flux entering the oceans in response to the solar cycle is about an order of magnitude larger than the globally averaged irradiance variations of 0.17 W/m2. The sheer size of the heat flux, and the lack of any phase lag between the flux and the driving force further implies that it cannot be part of an atmospheric feedback and very unlikely to be part of a coupled atmosphere-ocean oscillation mode. It must therefore be the manifestation of real variations in the global radiative forcing. [74] It should be stressed that the observed correlation between the oceanic heat flux and solar activity does not provide proof for any particular amplification mechanism, including that of the CRF/climate link. It does however provide very strong support for the notion that an amplification mechanism exists. Given that the CRF/climate links predicts the correct radiation imbalance observed in the cloud cover variations, it is a favorable candidate. [75] With respect to simulating climate dynamics, the results have two very interesting ramifications. First, they imply that any attempt to explain historic temperature variations should consider that the solar forcing variations are almost an order of magnitude larger that just the TSI variations now used almost exclusively. It would imply that the climate sensitivity required to explain historic temperature variations is smaller than often concluded. [76] Second, an additional constraint can be used to narrow the range of GCMs’ model parameters. Under solar cycle like periodic forcing, a GCM should predict that the ratio between the oceanic heat flux and sea-surface temperature variations is that which is observed, namely, a net oceanic flux of 1.05 ± 0.25 W/m2 for every 0.09 ± 0.01 C change in the sea-surface temperature (or somewhat larger land surface temperature variations). This should prove useful in constraining GCM based predictions, such as that of climate sensitivity.
The Abstract states:
“The ACRIM-gap (1989.5-1991.75) continuity dilemma for satellite TSI observations is resolved by bridging the satellite TSI monitoring gap between ACRIM1 and ACRIM2 results with TSI derived from Krivova et al.’s (2007) proxy model based on variations of the surface distribution of solar magnetic flux. ‘Mixed’ versions of ACRIM and PMOD TSI composites are constructed with their composites’ original values except for the ACRIM gap, where Krivova modeled TSI is used to connect ACRIM1 and ACRIM2 results. Both ‘mixed’ composites demonstrate a significant TSI increase of 0.033%/decade between the solar activity minima of 1986 and 1996, comparable to the 0.037% found in the ACRIM composite. The finding supports the contention of Willson (1997) that the ERBS/ERBE results are flawed by uncorrected degradation during the ACRIM gap and refutes the Nimbus7/ERB ACRIM gap adjustment Fröhlich and Lean (1998) employed in constructing the PMOD.”
The authors state in their conclusions that:
“This finding has evident repercussions for climate change and solar physics. Increasing TSI between 1980 and 2000 could have contributed significantly to global warming during the last three decades [Scafetta and West, 2007, 2008]. Current climate models [Intergovernmental Panel on Climate Change, 2007] have assumed that the TSI did not vary significantly during the last 30 years and have therefore underestimated the solar contribution and overestimated the anthropogenic contribution to global warming.”
Keywords
- total solar irradiance (TSI)
- irradiance variability
- irradiance trend
Nir Shaviv’s latest paper has been published in the Journal of Geophysical Research (Space Physics, 2008)). It is entitled: ‘Using the oceans as a calorimeter to quantify the solar radiative forcing.’ The Abstract states:
Over the 11-year solar cycle, small changes in the total solar irradiance (TSI) give rise to small variations in the global energy budget. It was suggested, however, that different mechanisms could amplify solar activity variations to give large climatic effects, a possibility which is still a subject of debate. With this in mind, we use the oceans as a calorimeter to measure the radiative forcing variations associated with the solar cycle. This is achieved through the study of three independent records, the net heat flux into the oceans over 5 decades, the sea-level change rate based on tide gauge records over the 20th century, and the sea-surface temperature variations. Each of the records can be used to consistently derive the same oceanic heat flux. We find that the total radiative forcing associated with solar cycles variations is about 5 to 7 times larger than just those associated with the TSI variations, thus implying the necessary existence of an amplification mechanism, although without pointing to which one.
The paper concludes:
In summary, we find clear evidence indicating that the total flux entering the oceans in response to the solar cycle is about an order of magnitude larger than the globally averaged irradiance variations of 0.17 W/m2. The sheer size of the heat flux, and the lack of any phase lag between the flux and the driving force further implies that it cannot be part of an atmospheric feedback and very unlikely to be part of a coupled atmosphere-ocean oscillation mode. It must therefore be the manifestation of real variations in the global radiative forcing. [74] It should be stressed that the observed correlation between the oceanic heat flux and solar activity does not provide proof for any particular amplification mechanism, including that of the CRF/climate link. It does however provide very strong support for the notion that an amplification mechanism exists. Given that the CRF/climate links predicts the correct radiation imbalance observed in the cloud cover variations, it is a favorable candidate. [75] With respect to simulating climate dynamics, the results have two very interesting ramifications. First, they imply that any attempt to explain historic temperature variations should consider that the solar forcing variations are almost an order of magnitude larger that just the TSI variations now used almost exclusively. It would imply that the climate sensitivity required to explain historic temperature variations is smaller than often concluded. [76] Second, an additional constraint can be used to narrow the range of GCMs’ model parameters. Under solar cycle like periodic forcing, a GCM should predict that the ratio between the oceanic heat flux and sea-surface temperature variations is that which is observed, namely, a net oceanic flux of 1.05 ± 0.25 W/m2 for every 0.09 ± 0.01 C change in the sea-surface temperature (or somewhat larger land surface temperature variations). This should prove useful in constraining GCM based predictions, such as that of climate sensitivity.
"Our reconstructed temperatures are significantly correlated with the 10Be and 14C based solar activity reconstructions in the period 1250-1850, but not with the greenhouse gas CO2 (Figure 2b). This indicates that solar activity changes are a main driver for the temperature variation in the Altai region during the pre industrial time. However, during the industrial period (1850-2000) solar forcing became less important and only the CO2 concentrations show a significant correlation with the temperature record."
That's just plain wrong and I didn't say I agreed with the statement anywhere.

Solar to temperature well established over the period in question, carbon dioxide is a spectator.
Before the predictable comment is made about the last 30 years of the plot, remember that the temperature rise shown is exaggerated by 100% and the overall drop in temeperature since then is in keeping with the solar downturn still visible.
UW-Milwaukee Study Could Realign Climate Change Theory
Scientists Claim Earth Is Undergoing Natural Climate Shift
POSTED: 3:18 pm CDT March 15, 2009
UPDATED: 11:50 am CDT March 16, 2009
MILWAUKEE -- The bitter cold and record snowfalls from two wicked winters are causing people to ask if the global climate is truly changing.
The climate is known to be variable and, in recent years, more scientific thought and research has been focused on the global temperature and how humanity might be influencing it.
However, a new study by the University of Wisconsin-Milwaukee could turn the climate change world upside down.
Scientists at the university used a math application known as synchronized chaos and applied it to climate data taken over the past 100 years.
"Imagine that you have four synchronized swimmers and they are not holding hands and they do their program and everything is fine; now, if they begin to hold hands and hold hands tightly, most likely a slight error will destroy the synchronization. Well, we applied the same analogy to climate," researcher Dr. Anastasios Tsonis said.
Scientists said that the air and ocean systems of the earth are now showing signs of synchronizing with each other.
Eventually, the systems begin to couple and the synchronous state is destroyed, leading to a climate shift.
"In climate, when this happens, the climate state changes. You go from a cooling regime to a warming regime or a warming regime to a cooling regime. This way we were able to explain all the fluctuations in the global temperature trend in the past century," Tsonis said. "The research team has found the warming trend of the past 30 years has stopped and in fact global temperatures have leveled off since 2001."
The most recent climate shift probably occurred at about the year 2000.
Now the question is how has warming slowed and how much influence does human activity have?
"But if we don't understand what is natural, I don't think we can say much about what the humans are doing. So our interest is to understand -- first the natural variability of climate -- and then take it from there. So we were very excited when we realized a lot of changes in the past century from warmer to cooler and then back to warmer were all natural," Tsonis said.
Tsonis said he thinks the current trend of steady or even cooling earth temps may last a couple of decades or until the next climate shift occurs.
As the relationship between ocean-atmosphere cycles such as NAO (as per this thread title), PDO, AMO and ENSO is now under study and mention has already been made of the Pacific Decadal Oscillation, some more on that is timely.
The PDO is linked to the solar Gleissberg Cycle, through solar eruptivity (again) as well as irradiance:
http://www.heartland.org/bin/media/newyork09/Power...
Solar irradiance changes - often claimed to be minor by manmade warmers - are amplified between 5x and 7x (Shaviv, 2008):
http://www.agu.org/pubs/crossref/2008/2007JA012989...
Note that, almost always if not always, solar eruptivity forcings, which operate via magnetic effects and the solar wind, get missed by manmade warmers. Even when irradiance is mentioned, the recent demonstration of amplification (above) is not mentioned. I demonstrated on this thread a few posts back now that the solar eruptivity forcing through cosmic ray flux (CRF) modulation of low level clouds (LLC) and hence albedo, even within the artificial constraints of Shaviv's critics (Sloan and Wolfendale) is between 10 and 40 times greater than the aircraft linear contrail forcing guestimated by the IPCC and included in their report to political policymakers (AR4 SPM). Yet the IPCC omit the eruptivity forcing from CRF/LLC.
My calculation on eruptivity forcing using published data and with sources is in the post timed yesterday (Monday) at 16:13 under the list of climate forcings. At this stage it's not easy to quantify the link between auroral oval impacts on global atmospheric circulation patterns (e.g. Bucha's work) in terms of a numerical forcing, but given that our planet's climate is a coupled ocean-atmosphere system, and the growing evidence for solar-NAO/PDO links, it should not be forgotten or omitted. But it is.
Carrying another theme forward, Spencer has looked at PDO and cloud cover revealed by the Aqua satellite, showing another natural climate forcing with solar links operating in recent years:
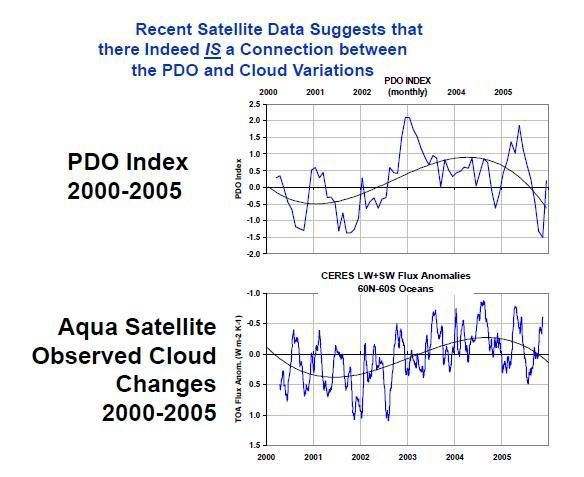
The relationship between natural cycle phasing, total solar forcing and climate is already an area with significant research effort as per PMBBiggsy's post and this is bound to continue over the next few years, so some interesting results look likely in the near future.
The PDO is linked to the solar Gleissberg Cycle, through solar eruptivity (again) as well as irradiance:
http://www.heartland.org/bin/media/newyork09/Power...
Solar irradiance changes - often claimed to be minor by manmade warmers - are amplified between 5x and 7x (Shaviv, 2008):
http://www.agu.org/pubs/crossref/2008/2007JA012989...
Note that, almost always if not always, solar eruptivity forcings, which operate via magnetic effects and the solar wind, get missed by manmade warmers. Even when irradiance is mentioned, the recent demonstration of amplification (above) is not mentioned. I demonstrated on this thread a few posts back now that the solar eruptivity forcing through cosmic ray flux (CRF) modulation of low level clouds (LLC) and hence albedo, even within the artificial constraints of Shaviv's critics (Sloan and Wolfendale) is between 10 and 40 times greater than the aircraft linear contrail forcing guestimated by the IPCC and included in their report to political policymakers (AR4 SPM). Yet the IPCC omit the eruptivity forcing from CRF/LLC.
My calculation on eruptivity forcing using published data and with sources is in the post timed yesterday (Monday) at 16:13 under the list of climate forcings. At this stage it's not easy to quantify the link between auroral oval impacts on global atmospheric circulation patterns (e.g. Bucha's work) in terms of a numerical forcing, but given that our planet's climate is a coupled ocean-atmosphere system, and the growing evidence for solar-NAO/PDO links, it should not be forgotten or omitted. But it is.
Carrying another theme forward, Spencer has looked at PDO and cloud cover revealed by the Aqua satellite, showing another natural climate forcing with solar links operating in recent years:
The relationship between natural cycle phasing, total solar forcing and climate is already an area with significant research effort as per PMBBiggsy's post and this is bound to continue over the next few years, so some interesting results look likely in the near future.
turbobloke said:
"Our reconstructed temperatures are significantly correlated with the 10Be and 14C based solar activity reconstructions in the period 1250-1850, but not with the greenhouse gas CO2 (Figure 2b). This indicates that solar activity changes are a main driver for the temperature variation in the Altai region during the pre industrial time. However, during the industrial period (1850-2000) solar forcing became less important and only the CO2 concentrations show a significant correlation with the temperature record."
That's just plain wrong and I didn't say I agreed with the statement anywhere.
Solar to temperature well established over the period in question, carbon dioxide is a spectator.
Before the predictable comment is made about the last 30 years of the plot, remember that the temperature rise shown is exaggerated by 100% and the overall drop in temeperature since then is in keeping with the solar downturn still visible.
1st point: I didn't say you agreed with their position, I just found it odd that you would quote their paper, when it confirms AGW.That's just plain wrong and I didn't say I agreed with the statement anywhere.
Solar to temperature well established over the period in question, carbon dioxide is a spectator.
Before the predictable comment is made about the last 30 years of the plot, remember that the temperature rise shown is exaggerated by 100% and the overall drop in temeperature since then is in keeping with the solar downturn still visible.
2nd point: what does the temp anomaly that your chart shows refer to? Looks a lot like Northern Hemisphere to me. Check out Friis-Christensen and Lassen in 1991.
Hi Nigel
Sorry to butt in on a fascinating conversation but is there any chance you could spare some time in your hectic life to apply your supreme intellect and peerless reasoning to the following equally weighty problems and let us know the solutions?
1. The global recession
2. How to defeat the Taleban
3. Social deprivation in urban Britain
4. Footballers feigning injury
5. Whether fancy fuels such as BP ultimate and Shell VPower are worth it
6. Do planks belong on internet forums?
Do you have a blog btw? If not i reckon you should set one up and post all the answers there, I am sure the powers that be on PH can post a sticky on a special forum to redirect users to it.
In the meantime keep up the good work.
J.

It's not tax gas, that's for sure.
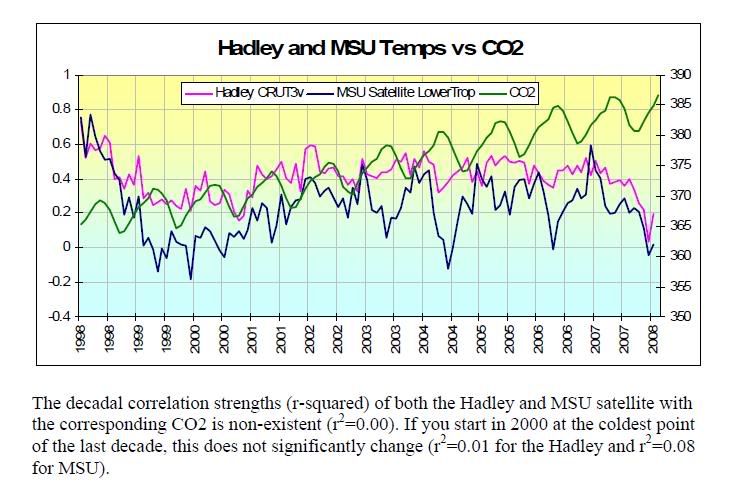
Temperature sources clearly visible, tax gas is the Mauna Loa record. So, over the decade to 2008 when emissions and atmospheric levels of carbon dioxide have risen fast, the correlation to global temperature is precisely ZERO. Needless to say there is no cause-and-effect established between carbon dioxide and temperature either, on this or any timescale.
As to the decadal timescale, it's fair game as apparently we have 100 months to do 'something' using taxation and societal controls, something that isn't necessary and via a route that has absolutely no correlation or causal link to what's trying to be done, and the thing is something that can't be done anyway.
http://news.bbc.co.uk/1/hi/sci/tech/7513415.stm
Looking at some of the daft statements around this 100 months nonsense, it appears there's a group setting out to stop climate chaos: fascinating stuff, as the Earth's ocean-atmopsphere climate system is chaotic - always has been and always will be. Maybe there'll be a 'surface action' group forming soon to stop gravity working downwards or flotation working upwards. The only barrier appears to be whethere there's any tax in it.
Guam said:
Nige I am getting confused as to what you are trying to say here?
Do I take it you accept the MWP existed then and it was as a result of "Natural Forcings" (something TB has contended for years in support of the natural variability in the climate (Like with the little Ice Age).
Is what you are trying to say is that all of this was driven by natural Ocean Temperatures and is wholly independent of Solar activity?
Clearly that cannot be correct as that would mean that the Sun has no impact on temperature?
Can you summarrise the arguement for me as I am afraid my creaking grey matter is missing the point on this issue
Cheers
Tom
Hi Tom,Do I take it you accept the MWP existed then and it was as a result of "Natural Forcings" (something TB has contended for years in support of the natural variability in the climate (Like with the little Ice Age).
Is what you are trying to say is that all of this was driven by natural Ocean Temperatures and is wholly independent of Solar activity?
Clearly that cannot be correct as that would mean that the Sun has no impact on temperature?
Can you summarrise the arguement for me as I am afraid my creaking grey matter is missing the point on this issue
Cheers
Tom
Here's my post from Saturday.
nigelfr said:
Now the responses so far have been interesting: I see some of the ditto bots have turned up and revealed that they haven't learnt anything about the "It's the Sun" theory of GW even though it has been mentioned here a lot by the sceptics as an alternative to AGW.
In brief: some people have compared proxies of sun spot counts against temperature and have used the medieval warm period in Europe to "prove" a correlation. Now there is no proven mechanism to show cause and effect and also Europe is not the world, so a warm Europe doesn't really show global temperature.
Sceptics of this sunspot theory have suggested that an oscillation in the Atlantic (NAO) like the ENSO in the Pacific could explain the MWP. The report as mentioned on Physics.org sounds interesting.
Edited by nigelfr on Saturday 4th April 16:54
Is the claim for MWP really stretching credulity by asserting a prolonged NAO phase - over centuries? Surely not, the NAO idealised cycle used by a couple of researches I've read is about 12 years and it goes down and up, but not a lot.
The latest NAO PDO AMO ENSO papers are moving things forward nicely but it's not news: back in 2002 Kodera published in GRL on the modulation of NAO through solar forcing. Result - the spatial structure of the NAO differs significantly according to the phase of the Hale solar cycle.
What it doesn't seem to do is get stuck.
turbobloke said:
First of all is the plot of CO2, which as I mentioned before should be log CO2 concentration if you want to argue against AGW.
The really odd thing that I don't understand is the red data points: they show length of solar cycle which ranges between about 10 and 12 years, commonly known as the 11 year (half) cycle.
The first one is 1860 and the last is 1985. What I can't figure out is how you manage to fit 21 red dots in between. That's over 230 years of solar cycles in 125 years!
Transfer functions and various digital tools allow continuous variables to be obtained from discrete variables - and there are smoothing filters commonly used in plots such as those here - means exist to allow matching of data on different timescales (the solar cycle length and the temperature anomaly) and of diffrent types, you could ask Friis-Christensen or Lassen. Plots with reciprocal cycle length (T) untouched are possible, either as 1/T or simply with the cycle length scale increasing downwards on the y-axis. The issue of how many points there are isn't one that can falsify the relationship shown.
The idea of using a log plot is curious, I can't see how it would help make things look any better, in appearance or reality. Ten seconds in Excel shows what the general type of curve that carbon dioxide exhibits over time would look as a log plot (log10 shown here). The curve mimicking the shape of the carbon dioxide trend is in blue, the corresponding log plot is in red. Whatever, it doesn't make things any better.
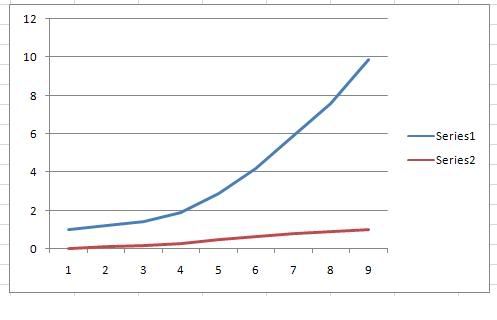
The idea of using a log plot is curious, I can't see how it would help make things look any better, in appearance or reality. Ten seconds in Excel shows what the general type of curve that carbon dioxide exhibits over time would look as a log plot (log10 shown here). The curve mimicking the shape of the carbon dioxide trend is in blue, the corresponding log plot is in red. Whatever, it doesn't make things any better.
Can you give real references for the data used in the sunspot cycle vs temperature graph? The graph itself comes from here a ‘skeptic', politics heavy, blog:
http://www.kowabunga.org/2007/03/global_warming_lo...
The text there says that the original figure comes from;
http://www.friendsofscience.org/
Another ‘skeptic’ blog. I can’t seem to find the figure on there though.
http://www.kowabunga.org/2007/03/global_warming_lo...
The text there says that the original figure comes from;
http://www.friendsofscience.org/
Another ‘skeptic’ blog. I can’t seem to find the figure on there though.
Edited by hairykrishna on Wednesday 8th April 17:17
Edited by hairykrishna on Wednesday 8th April 17:27
Gassing Station | News, Politics & Economics | Top of Page | What's New | My Stuff