Medieval Warm period due to NAO
Discussion


mybrainhurts said:
nigelfr said:
mybrainhurts said:
I think we should keep our Nige...
He was fun before but it can only get better if he repeats that meticulously planned sting thread that blew up in his his face a while ago....
What the heck are you going on about?He was fun before but it can only get better if he repeats that meticulously planned sting thread that blew up in his his face a while ago....
tinman0 said:
nigelfr] said:
Oh man that is soooo wrong.
Go look it up. First it was global cooling, now its global warming.Here you go:
http://en.wikipedia.org/wiki/Global_cooling
Edited by tinman0 on Sunday 5th April 18:37
Er isn't that basically what Ludo said?
ETA I assume you read the link that you provided, so why do you then say this...
tinman0 said:
Who were the press listening to? DId they just make it up? Course there were scientists behind, and course there are studies supporting it and disputing it. Just like we have today with Global Warming, now renamed Climate Change to hedge the bets properly, because even the Global Warming people couldn't be sure, but to really f k up the human race they needed that extra bet.
Regardless of who is wrong and who is right, my point was that in the 70s, the "world" was considering global cooling rather than global warming. This apparently is new to Nige.
It wasn't news to me: the "70's global cooling myth " is well known and well debunked. Just Google it and see.k up the human race they needed that extra bet.Regardless of who is wrong and who is right, my point was that in the 70s, the "world" was considering global cooling rather than global warming. This apparently is new to Nige.
Edited by nigelfr on Sunday 5th April 19:17
turbobloke said:
ludo said:
turbobloke said:
The IPCC don't have a triple A rating. When a view is orchestrated, you need the right view to get in the orchestra. Expaining it makes it no better.
ludo said:
The point is that it is the argument that matters, not the source.
...
turbobloke said:
nigelfr said:
Sailing perilously close to "Reductio ad absurdum" there, old chap. Wouldn't want to have to accuse you of stooping to cheap rhetorical tricks.
Yes it would be inappropriate, and you;d be falling foul of your earlier post if you did:nigelfr said:
Try to play the ball, not the man please.
And I do like a happy ending.
BTW It's holiday time and I've got guests arriving so that means little time for posting.
Once again it's been a blast. Big thanks to all the genuine debaters and not such a big thanks to the mass (except for the few funny ones.)
Cheers, take care.
ludo said:
nigelfr said:
turbobloke said:
Maybe this is now overlapping with the Sea Level Rise Scam thread but as somebody else started asking:

D'oh. That bottom chart ain't CO2 concentration but rate of change in CO2 concentration. 
http://www.nodc.noaa.gov/OC5/3M_HEAT_CONTENT/
Also here ftp://ftp.nodc.noaa.gov/pub/data.nodc/woa/PUBLICATIONS/grlheat08.pdf see figure S9
Enjoy.
Now I really have to go.
Caio.
Bad, turbobloke, bad and sadly predictable...
Finally, commentary (argument? discussion) from Tsonis:
"I don't think we can say much about what the humans are doing". Dr. Anastasios Tsonis said. Scientists note that the air and ocean systems of the Earth are now showing signs of synchronizing with each other. Eventually, the systems begin to couple and the synchronous state is destroyed, leading to a climate shift. "In climate, when this happens, the climate state changes. You go from a cooling regime to a warming regime or a warming regime to a cooling regime. This way we were able to explain all the fluctuations in the global temperature trend in the past century," Tsonis said. "The research team has found the warming trend of the past 30 years has stopped and in fact global temperatures have leveled off since 2001." The most recent climate shift probably occurred at about the year 2000. Now the question is how has warming slowed and how much influence does human activity have. "But if we don't understand what is natural, I don't think we can say much about what the humans are doing. So our interest is to understand first the natural variability of climate and then take it from there. So we were very excited when we realized a lot of changes in the past century from warmer to cooler and then back to warmer were all natural," Tsonis said. Tsonis said he thinks the current trend of steady or even cooling earth temps may last a couple of decades or until the next climate shift occurs.We have a result, 'cos I published this snippet on 21st March 2009 http://www.pistonheads.com/gassing/topic.asp?h=0&a...
turbobloke said:
Finally, commentary (argument? discussion) from Tsonis:
"I don't think we can say much about what the humans are doing". Dr. Anastasios Tsonis said. Scientists note that the air and ocean systems of the Earth are now showing signs of synchronizing with each other. Eventually, the systems begin to couple and the synchronous state is destroyed, leading to a climate shift. "In climate, when this happens, the climate state changes. You go from a cooling regime to a warming regime or a warming regime to a cooling regime. This way we were able to explain all the fluctuations in the global temperature trend in the past century," Tsonis said. "The research team has found the warming trend of the past 30 years has stopped and in fact global temperatures have leveled off since 2001." The most recent climate shift probably occurred at about the year 2000. Now the question is how has warming slowed and how much influence does human activity have. "But if we don't understand what is natural, I don't think we can say much about what the humans are doing. So our interest is to understand first the natural variability of climate and then take it from there. So we were very excited when we realized a lot of changes in the past century from warmer to cooler and then back to warmer were all natural," Tsonis said. Tsonis said he thinks the current trend of steady or even cooling earth temps may last a couple of decades or until the next climate shift occurs.
nigelfr said:
Kyle L. Swanson and Anastasios A. Tsonis, professors in the Department of Mathematical Sciences at the University of Wisconsin-Milwaukee have recently published a paper with a theory that they think explains some of the natural changes in climate.
http://www.uwm.edu/~kswanson/publications/2008GL03...
These scientists hold the mainstream view that some climate change is natural and some is man-made.
The denierblogsphere has lit up with the report of their paper, claiming that it disproves AGW.
One classic mis-quote of Prof. Anastasios A. Tsonis that I've seen is "I don't think we can say much about what the humans are doing.", whereas the whole sentence is ""But if we don't understand what is natural, I don't think we can say much about what the humans are doing."
The deniers also miss out interesting snippets like:
"Moreover, we caution that the shifts described here are presumably superimposed upon a long term warming trend due to anthropogenic forcing."
and
"Finally, it is vital to note that there is no comfort to be gained by having a climate with a significant degree of internal variability, even if it results in a near-term cessation of global warming. It is straightforward to argue that a climate with significant internal variability is a climate that is very sensitive to applied anthropogenic radiative anomalies. If the role of internal variability in the climate system is as large as this analysis would seem to suggest, warming over the 21st century may well be larger than that predicted by the current generation of models, given the propensity of those models to underestimate climate internal variability."
So back to the point of this post... who reckons that Senator Inhofe's next list of dissenters will include Tsonis and/or Swanson?
pmbbiggsy said:
...
The Abstract states:
Models and data suggest that the interplay of major climate modes may result in climate shifts [Tsonis et al., 2007]. More specifically it has been shown that when the network of North Atlantic Oscillation (NAO), Pacific Decadal Oscillation (PDO), El Nino/Southern Oscillation (ENSO) and North Pacific Index (NPI) synchronizes, an increase in the coupling between these oscillations destroys the synchronous state and leads the climate system to a new state. These shifts are associated with significant changes in global temperature trend and in ENSO variability. Here we probe the details of this network’s dynamics to investigate if a certain oscillation is the culprit in these shifts. From a total of 12 synchronization events observed in three climate simulations and in observations we find that the instigator of these shifts is NAO. Without exception only when NAO’s coupling with the Pacific increases a shift will occur. Our results suggest a dynamical sequence of events in the evolution of climate shifts which is consistent with recent independent empirical and modeling studies.
The paper concludes:
Many studies have in the past dealt with the origin and mechanisms of climate oscillations as well as with the consequences of their interactions. Our study with the help of a novel approach identifies for the first time which may be the most significant of these oscillations. In a dynamical scenario where the major modes of variability in the northern hemisphere are synchronized, an increase in the coupling strength destroys the synchronous state and causes climate to shift to a new state. Here we were able to identify that the major participant in this coupling strength increase is NAO, which we found to be behind all climate shifts observed in observations as well as in three climate simulations. Understanding variability of our extremely complex climate system is far from complete as new and often contradicting views are proposed. In this realm we hope that our results will provide some direction and focus to this perpetual quest for understanding climate variability.
Kyle Swanson and Anastasios Tsonis GRL (2009):‘Has the climate recently shifted?’
The Abstract states:
This paper provides an update to an earlier work that showed specific changes in the aggregate time evolution of major Northern Hemispheric atmospheric and oceanic modes of variability serve as a harbinger of climate shifts. Specifically, when the major modes of Northern Hemisphere climate variability are synchronized, or resonate, and the coupling between those modes simultaneously increases, the climate system appears to be thrown into a new state, marked by a break in the global mean temperature trend and in the character of El Ni˜no/Southern Oscillation variability. Here, a new and improved means to quantify the coupling between climate modes confirms that another synchronization of these modes, followed by an increase in coupling occurred in 2001/02. This suggests that a break in the global mean temperature trend from the consistent warming over the 1976/77–2001/02 period may have occurred.
The paper concludes:
If as suggested here, a dynamically driven climate shift has occurred, the duration of similar shifts during the 20th century suggests the new global mean temperature trend[b/]may persist for several decades. Of course, it is purely speculative to presume that the global mean temperature will remain near current levels for such an extended period of time. [b]Moreover, we caution that the shifts described here are presumably superimposed upon a long term warming trend due to anthropogenic forcing. However, the nature of these past shifts in climate state suggests the possibility of near constant temperature lasting a decade or more into the future must at least be entertained. The apparent lack of a proximate cause behind the halt in warming post 2001/02 challenges our understanding of the climate system, specifically the physical reasoning and causal links between longer time-scale modes of internal climate variability and the impact of such modes upon global temperature. Fortunately, climate science is rapidly developing the tools to meet this challenge, as in the near future it will be possible to attribute cause and effect in decadal scale climate variability within the context of a seamless climate forecast system [Palmer et al. 2008]. Doing so is vital, as the future evolution of the global mean temperature may hold surprises on both the warm and cold ends of the spectrum due entirely to internal variability that lie well outside the envelope of a steadily increasing global mean temperature.
Tsonis et al, GRL (2007): 'A new dynamical mechanism for major climate shifts'
In the mid-1970s, a climate shift cooled sea surface temperatures in the central Pacific Ocean and warmed the coast of western North America, bringing long-range changes to the northern hemisphere. After this climate shift waned, an era of frequent El Ninos and rising global temperatures began.
Tsonis et al. have investigated the collective behavior of known climate cycles such as the Pacific Decadal Oscillation, the North Atlantic Oscillation, the El Nino/Southern Oscillation, and the North Pacific Oscillation. By studying the last 100 years of these cycles' patterns, they find that the systems synchronized several times.
Further, in cases where the synchronous state was followed by an increase in the coupling strength among the cycles, the synchronous state was destroyed. Then. a new climate state emerged, associated with global temperature changes and El Nino/Southern Oscillation variability.
The authors show that this mechanism explains all global temperature tendency changes and El Nino variabilityin the 20th century.
Major climate shifts have occurred or will occur around 1913, 1942, 1978, 2033, and 2072 according to the authors of this recent paper, who also predict a 0.2 Celsius cooling between 2005 and 2020 which should be followed by a 0.3 Celsius warming until 2045 or so - then cooling for the rest of the 21st century.
Anyway, the Trouet et al 2009 MCA/NAO paper is seriously flawed.
From all the premature ejaculations of joy and happiness, I can only presume the sentence that I put in bold escaped you.The Abstract states:
Models and data suggest that the interplay of major climate modes may result in climate shifts [Tsonis et al., 2007]. More specifically it has been shown that when the network of North Atlantic Oscillation (NAO), Pacific Decadal Oscillation (PDO), El Nino/Southern Oscillation (ENSO) and North Pacific Index (NPI) synchronizes, an increase in the coupling between these oscillations destroys the synchronous state and leads the climate system to a new state. These shifts are associated with significant changes in global temperature trend and in ENSO variability. Here we probe the details of this network’s dynamics to investigate if a certain oscillation is the culprit in these shifts. From a total of 12 synchronization events observed in three climate simulations and in observations we find that the instigator of these shifts is NAO. Without exception only when NAO’s coupling with the Pacific increases a shift will occur. Our results suggest a dynamical sequence of events in the evolution of climate shifts which is consistent with recent independent empirical and modeling studies.
The paper concludes:
Many studies have in the past dealt with the origin and mechanisms of climate oscillations as well as with the consequences of their interactions. Our study with the help of a novel approach identifies for the first time which may be the most significant of these oscillations. In a dynamical scenario where the major modes of variability in the northern hemisphere are synchronized, an increase in the coupling strength destroys the synchronous state and causes climate to shift to a new state. Here we were able to identify that the major participant in this coupling strength increase is NAO, which we found to be behind all climate shifts observed in observations as well as in three climate simulations. Understanding variability of our extremely complex climate system is far from complete as new and often contradicting views are proposed. In this realm we hope that our results will provide some direction and focus to this perpetual quest for understanding climate variability.
Kyle Swanson and Anastasios Tsonis GRL (2009):‘Has the climate recently shifted?’
The Abstract states:
This paper provides an update to an earlier work that showed specific changes in the aggregate time evolution of major Northern Hemispheric atmospheric and oceanic modes of variability serve as a harbinger of climate shifts. Specifically, when the major modes of Northern Hemisphere climate variability are synchronized, or resonate, and the coupling between those modes simultaneously increases, the climate system appears to be thrown into a new state, marked by a break in the global mean temperature trend and in the character of El Ni˜no/Southern Oscillation variability. Here, a new and improved means to quantify the coupling between climate modes confirms that another synchronization of these modes, followed by an increase in coupling occurred in 2001/02. This suggests that a break in the global mean temperature trend from the consistent warming over the 1976/77–2001/02 period may have occurred.
The paper concludes:
If as suggested here, a dynamically driven climate shift has occurred, the duration of similar shifts during the 20th century suggests the new global mean temperature trend[b/]may persist for several decades. Of course, it is purely speculative to presume that the global mean temperature will remain near current levels for such an extended period of time. [b]Moreover, we caution that the shifts described here are presumably superimposed upon a long term warming trend due to anthropogenic forcing. However, the nature of these past shifts in climate state suggests the possibility of near constant temperature lasting a decade or more into the future must at least be entertained. The apparent lack of a proximate cause behind the halt in warming post 2001/02 challenges our understanding of the climate system, specifically the physical reasoning and causal links between longer time-scale modes of internal climate variability and the impact of such modes upon global temperature. Fortunately, climate science is rapidly developing the tools to meet this challenge, as in the near future it will be possible to attribute cause and effect in decadal scale climate variability within the context of a seamless climate forecast system [Palmer et al. 2008]. Doing so is vital, as the future evolution of the global mean temperature may hold surprises on both the warm and cold ends of the spectrum due entirely to internal variability that lie well outside the envelope of a steadily increasing global mean temperature.
Tsonis et al, GRL (2007): 'A new dynamical mechanism for major climate shifts'
In the mid-1970s, a climate shift cooled sea surface temperatures in the central Pacific Ocean and warmed the coast of western North America, bringing long-range changes to the northern hemisphere. After this climate shift waned, an era of frequent El Ninos and rising global temperatures began.
Tsonis et al. have investigated the collective behavior of known climate cycles such as the Pacific Decadal Oscillation, the North Atlantic Oscillation, the El Nino/Southern Oscillation, and the North Pacific Oscillation. By studying the last 100 years of these cycles' patterns, they find that the systems synchronized several times.
Further, in cases where the synchronous state was followed by an increase in the coupling strength among the cycles, the synchronous state was destroyed. Then. a new climate state emerged, associated with global temperature changes and El Nino/Southern Oscillation variability.
The authors show that this mechanism explains all global temperature tendency changes and El Nino variabilityin the 20th century.
Major climate shifts have occurred or will occur around 1913, 1942, 1978, 2033, and 2072 according to the authors of this recent paper, who also predict a 0.2 Celsius cooling between 2005 and 2020 which should be followed by a 0.3 Celsius warming until 2045 or so - then cooling for the rest of the 21st century.
Anyway, the Trouet et al 2009 MCA/NAO paper is seriously flawed.
And the subtle bit that you really didn't understand is it talks about trends: what it's saying is that they have a better idea of when to expect the natural component of climate to change, from reducing to reinforcing AGW.
Multi-resolution analysis of global surface air temperature and solar activity relationship M.P. Souza Echera,E. Echerb, D.J.R. Nordemannb and N.R. Rigozo Journal of Atmospheric and Solar-Terrestrial Physics
Volume 71, Issue 1, January 2009, Pages 41-44
"In this work the surface temperature anomaly (dTG) and sunspot number (Rz) time series in the period 1880–2000 are studied with wavelet multi-resolution analysis. We found a very low correlation of 0.11 between dTG and Rz in the 11-yr-solar cycle band. A higher correlation of 0.66 is found in the not, vert, similar22-yr-band with zero lag correlation coefficient between dTG and Rz. Furthermore, the long-term trend is markedly different between dTG and Rz. This might occurs because of the long-term warming on the last century, which is attributed mainly to anthropogenic effects."
So: MWP/solar correlation killed by NAO.
And now the modern day warming and solar link is killed by lack of identifiable correlation.
Thanks Tom, I wish I could accept your congratulations, but I wasn't trying to call anyone a tosser. Sorry if I was a bit abrupt and lacking in tact.
The article has been quoted with such spin on the sceptic/denier sites, that it gives the impression that global warming has been explained rather than the trends in global temperature. This may create such an expectation in the casual reader that they don't pick up on the "trend" idea.
It's a mistake that is easy enough to make, so I didn't mean to insult anyone.
turbobloke said:
On Saturday I said:
T they state:
Spectral analysis of the Belukha temperature reconstruction shows significant periods at 205, 86, and 10.8 years, which can be related to the solar Suess, Gleissberg, and Schwabe cycles, respectively. The 8.3 and 2.3 periodicities are typical of the North Atlantic Oscillation (NAO) index [e.g., Cook et. al., 1998; Garcýa et. al., 2005], whereas the 5.2 year cycle is observed in both, solar and NAO data series.
Spectral analysis of the Belukha temperature reconstruction shows significant periods at 205, 86, and 10.8 years, which can be related to the solar Suess, Gleissberg, and Schwabe cycles, respectively. The 8.3 and 2.3 periodicities are typical of the North Atlantic Oscillation (NAO) index [e.g., Cook et. al., 1998; Garcýa et. al., 2005], whereas the 5.2 year cycle is observed in both, solar and NAO data series.
"Our reconstructed temperatures are significantly correlated with the 10Be and 14C based solar activity reconstructions in the period 1250-1850, but not with the greenhouse gas CO2 (Figure 2b). This indicates that solar activity changes are a main driver for the temperature variation in the Altai region during the pre industrial time. However, during the industrial period (1850-2000) solar forcing became less important and only the CO2 concentrations show a significant correlation with the temperature record. Our results are in agreement with studies based on NH temperature reconstructions [Scafetta et al., 2007] revealing that only up to approximately 50% of the observed global warming in the last 100 years can be explained by the Sun."
So you quote a paper that specifically denies the Solar/CRF/AGW link to support your case. Interesting technique, but I don't really think that it will catch on.
turbobloke said:
"Our reconstructed temperatures are significantly correlated with the 10Be and 14C based solar activity reconstructions in the period 1250-1850, but not with the greenhouse gas CO2 (Figure 2b). This indicates that solar activity changes are a main driver for the temperature variation in the Altai region during the pre industrial time. However, during the industrial period (1850-2000) solar forcing became less important and only the CO2 concentrations show a significant correlation with the temperature record."
That's just plain wrong and I didn't say I agreed with the statement anywhere.

Solar to temperature well established over the period in question, carbon dioxide is a spectator.
Before the predictable comment is made about the last 30 years of the plot, remember that the temperature rise shown is exaggerated by 100% and the overall drop in temeperature since then is in keeping with the solar downturn still visible.
1st point: I didn't say you agreed with their position, I just found it odd that you would quote their paper, when it confirms AGW.That's just plain wrong and I didn't say I agreed with the statement anywhere.
Solar to temperature well established over the period in question, carbon dioxide is a spectator.
Before the predictable comment is made about the last 30 years of the plot, remember that the temperature rise shown is exaggerated by 100% and the overall drop in temeperature since then is in keeping with the solar downturn still visible.
2nd point: what does the temp anomaly that your chart shows refer to? Looks a lot like Northern Hemisphere to me. Check out Friis-Christensen and Lassen in 1991.
Guam said:
Nige I am getting confused as to what you are trying to say here?
Do I take it you accept the MWP existed then and it was as a result of "Natural Forcings" (something TB has contended for years in support of the natural variability in the climate (Like with the little Ice Age).
Is what you are trying to say is that all of this was driven by natural Ocean Temperatures and is wholly independent of Solar activity?
Clearly that cannot be correct as that would mean that the Sun has no impact on temperature?
Can you summarrise the arguement for me as I am afraid my creaking grey matter is missing the point on this issue
Cheers
Tom
Hi Tom,Do I take it you accept the MWP existed then and it was as a result of "Natural Forcings" (something TB has contended for years in support of the natural variability in the climate (Like with the little Ice Age).
Is what you are trying to say is that all of this was driven by natural Ocean Temperatures and is wholly independent of Solar activity?
Clearly that cannot be correct as that would mean that the Sun has no impact on temperature?
Can you summarrise the arguement for me as I am afraid my creaking grey matter is missing the point on this issue
Cheers
Tom
Here's my post from Saturday.
nigelfr said:
Now the responses so far have been interesting: I see some of the ditto bots have turned up and revealed that they haven't learnt anything about the "It's the Sun" theory of GW even though it has been mentioned here a lot by the sceptics as an alternative to AGW.
In brief: some people have compared proxies of sun spot counts against temperature and have used the medieval warm period in Europe to "prove" a correlation. Now there is no proven mechanism to show cause and effect and also Europe is not the world, so a warm Europe doesn't really show global temperature.
Sceptics of this sunspot theory have suggested that an oscillation in the Atlantic (NAO) like the ENSO in the Pacific could explain the MWP. The report as mentioned on Physics.org sounds interesting.
Edited by nigelfr on Saturday 4th April 16:54
turbobloke said:
First of all is the plot of CO2, which as I mentioned before should be log CO2 concentration if you want to argue against AGW.
The really odd thing that I don't understand is the red data points: they show length of solar cycle which ranges between about 10 and 12 years, commonly known as the 11 year (half) cycle.
The first one is 1860 and the last is 1985. What I can't figure out is how you manage to fit 21 red dots in between. That's over 230 years of solar cycles in 125 years!
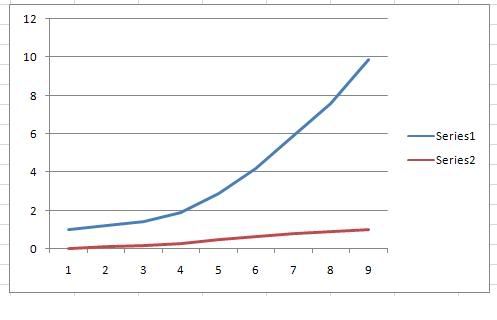
turbobloke said:
The idea of using a log plot is curious, I can't see how it would help make things look any better, in appearance or reality. Ten seconds in Excel shows what the general type of curve that carbon dioxide exhibits over time would look as a log plot (log10 shown here). The curve mimicking the shape of the carbon dioxide trend is in blue, the corresponding log plot is in red. Whatever, it doesn't make things any better.
AGW 101Climate sensitivity is the amount of global warming following a doubling of carbon dioxide concentrations. Estimates indicate that it is likely to be in the range of 2 to 4.5 °C, with a best estimate of about 3 °C. So go from about 280 ppm to 560 ppm for a warming in the range 2 to 4.5 °C. Double it again to 1120 to get the same temp. increase.
Like, er come on guys, you knew that didn't you?
mybrainhurts said:
nigelfr said:
following a doubling of carbon dioxide concentrations.
Given that carbon dioxide is bugger all of total greenhouse gas, it follows that doubling it is still bugger all.Given that most of it occurs naturally, mankind produces bugger all of bugger all.
Please explain how this leads to catastrophic armageddon in simple terms, for a simple lad.....
s2art said:
nigelfr said:
turbobloke said:
The idea of using a log plot is curious, I can't see how it would help make things look any better, in appearance or reality. Ten seconds in Excel shows what the general type of curve that carbon dioxide exhibits over time would look as a log plot (log10 shown here). The curve mimicking the shape of the carbon dioxide trend is in blue, the corresponding log plot is in red. Whatever, it doesn't make things any better.
AGW 101Climate sensitivity is the amount of global warming following a doubling of carbon dioxide concentrations. Estimates indicate that it is likely to be in the range of 2 to 4.5 °C, with a best estimate of about 3 °C. So go from about 280 ppm to 560 ppm for a warming in the range 2 to 4.5 °C. Double it again to 1120 to get the same temp. increase.
Like, er come on guys, you knew that didn't you?
Maths 101
Temp rise compared to concentration CO2 (as I said above) is an exponential function. To plot it fairly on a graph you need to take the log of CO2 concentration to make it "linear".
If you know enough to comment on regression techniques you should know that you have to compare the right variables. Comparing temp against CO2 concentration is not expected to give good correlation, because theory does not predict a linear relationship but an exponential one.
Gassing Station | News, Politics & Economics | Top of Page | What's New | My Stuff