Climate change - the POLITICAL debate. Vol 3
Discussion


durbster said:
If you fundamentally don't trust the scientific method then that's your perogative....
You have this backwards. A fundamental part of the scientific process is confirming predictions with observation. Show me a prediction from a reasonable amount of time ago (in climate science terms this might be 20 years ago) that has now been confirmed with uncorrupted modern observations.It is my trust in the scientific method that stops me being a believer. Without this crucial step, the science is incomplete. When I see accurate predictions that are then demonstrated to be reliable, I will start taking the theory seriously. It's very simple and something most people learn at age 11 in their first real science lessons.
alock said:
durbster said:
If you fundamentally don't trust the scientific method then that's your perogative....
You have this backwards. A fundamental part of the scientific process is confirming predictions with observation. Show me a prediction from a reasonable amount of time ago (in climate science terms this might be 20 years ago) that has now been confirmed with uncorrupted modern observations.It is my trust in the scientific method that stops me being a believer. Without this crucial step, the science is incomplete. When I see accurate predictions that are then demonstrated to be reliable, I will start taking the theory seriously. It's very simple and something most people learn at age 11 in their first real science lessons.
"I can't see either of these papers being in the next IPCC report. Kevin and I will keep them out somehow — even if we have to redefine what the peer-review literature is!"
alock said:
durbster said:
If you fundamentally don't trust the scientific method then that's your perogative....
You have this backwards. A fundamental part of the scientific process is confirming predictions with observation. Show me a prediction from a reasonable amount of time ago (in climate science terms this might be 20 years ago) that has now been confirmed with uncorrupted modern observations.alock said:
It is my trust in the scientific method that stops me being a believer. Without this crucial step, the science is incomplete. When I see accurate predictions that are then demonstrated to be reliable, I will start taking the theory seriously. It's very simple and something most people learn at age 11 in their first real science lessons.

As we saw from Briggs recently:
"It is true that global warming might be a partial cause of the anomaly sequence. Indeed, every working scientist assumes, what is almost a truism, that mankind has some effect on the climate. The only question is: how much? And the answer might be: only a trivial amount. Thus, it might also be true that global warming as a partial cause is ignorable for most questions or decisions made about values of temperature."
"How can we tell? Only one way. Build causal or determinative models that has global warming as a component. Then make predictions of future values of temperature. If these predictions match (how to match is important question I here ignore), then we have good (but not complete) evidence that global warming is a cause. But if they do not match, we have good evidence that it isn’t."
"Predictions of global temperature from models like CMIP, which are not shown in Mann, do not match the actual values of temperature, and haven’t for a long time. We therefore have excellent evidence that we do not understand all of the causes of global temperature and that global warming as it is represented in the models is in error."
There's no visible causal human signal in any global climate data even the tortured and corrupted near-surface data.
In any other field of science the equivalent of an AGW null hypothesis would have been rejected long ago. AGW is politicised nonscience.
alock said:
You have this backwards. A fundamental part of the scientific process is confirming predictions with observation. Show me a prediction from a reasonable amount of time ago (in climate science terms this might be 20 years ago) that has now been confirmed with uncorrupted modern observations.
Since you've put the caveat of "uncorrupted" in there, there's no possible response I can give. I can show you all the data in the world and you can simply dismiss it as corrupt. Since the data has to be adjusted to be meaningful (I don't think anybody disputes that... do they?), it's very easy to make accusations and assumptions about the intention of those adjustments without little burden of proof.But all the data is available for you to see - there's a tool here that allows you to see the adjustments for yourself:
http://www.ncdc.noaa.gov/temp-and-precip/divisiona...
If the Met, NASA and the NOAA really were being fraudulent or nefarious, don't you think they'd be a little more discreet about it?
For what it's worth, there were dozens of studies right back in the 1970s that predicted warming, and warming is exactly what has been observed since then (adjusted data or not). Here's one from 1974:
http://journals.ametsoc.org/doi/abs/10.1175/1520-0...
The Effects of Doubling the CO2 Concentration on the climate of a General Circulation Model said:
It is shown that the CO2 increase raises the temperature of the model troposphere, whereas it lowers that of the model stratosphere.
Here's one from 1983 that attempts to summarise the findings so far:http://www.gfdl.noaa.gov/bibliography/related_file...
Carbon Dioxide and Climatic Change said:
In this presentation, I have reviewed some of the CO2-climate sensitivity studies wihch have been conducted by various authors, in particular, by the staff members at the Geophysical Fluid Dynamic Laboratory of the NOAA... some of these CO2-induced changes of climate ... the temperature of the troposphere increases whereas that of the stratosphere decreases.
...
Note the phrase "climatic change" used in 1983, not global warming. ...

Europe's recent summers were the 'warmest in 2,000 years'
http://www.bbc.co.uk/news/science-environment-3543...
Er, so what !
"The study used tree ring records and historical documents to reconstruct yearly temperatures going back 2,100 years."
Nice and accurate then
"As a result, climate models may be underestimating the frequency and severity of heat waves in the future."
Er, that's because the are models. GIGO effect.
"To do this, the researchers used recently developed statistical reconstruction methods, as well as a number of what they term "high quality proxy records", to estimate the European mean temperature variation since 138 BC.
"We've got 2,000 years of reconstruction where we have values for every year and the big surprise was that there wasn't a single 30-year period that was as warm as the last 30 years; that was unexpected," said Prof Danny McCarroll from Swansea University, UK, who was part of the research group.
Projecting forward
The researchers then used modern climate models to predict past temperatures and compared the results with their newly reconstructed record.
"The modern models don't reconstruct the full range of climate change in the past, so they are underestimating the natural variability of the climate," said Prof McCarroll.
"When they predict forwards, they predict the effect of CO2 but they have to sit natural variability on top of it. If they underestimate that they underestimate the extremes - so the recurrence of heat waves are likely to be underestimated by these models."
Even though the new reconstruction has a wider range of natural variability in summer temperatures than previous attempts, the temperature data recorded in the past 30 years still sits outside it, pointing towards the same inference as made by the IPCC - that the recent warming is mainly caused by humans.
Image copyright Getty Images
Image caption Researchers say that the warming of the past 30 years is mainly down to human impacts
"The last 30 years lie beyond the bounds of natural variability," said Prof McCarroll.
"Climate modellers are always reticent to say a weather event is because of anthropogenic effects - but if you see those 30 years in the context of 2,000 years, and it's so unusual, it really suggests it is because of the greenhouse effect."
Can't be bothered to pick out the crap in that.
motco said:
durbster said:
Mind you, I did also find out that Sweden has a Homeopathic Emergency Room, which I'm now going to find out more about because it sounds f king hilarious
Yes, but the room is infinitesimally small as it is more effective that way...king hilarious durbster said:
But all the data is available for you to see - there's a tool here that allows you to see the adjustments for yourself:
http://www.ncdc.noaa.gov/temp-and-precip/divisiona...
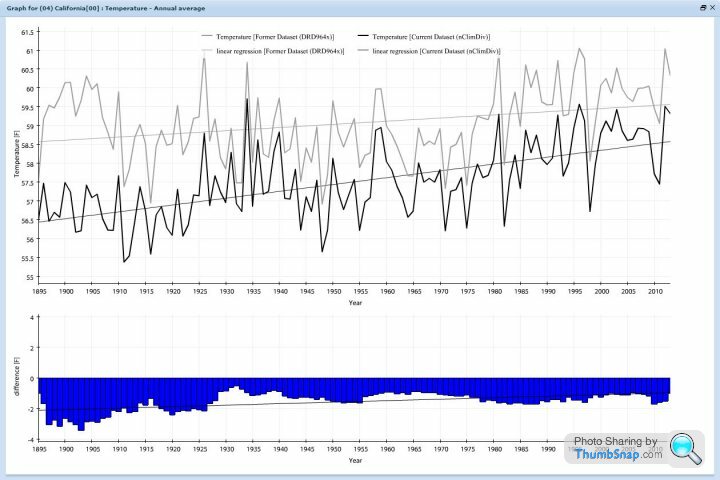
Durbster - I'm interested in this, can you (or anybody else for that matter) explain the graph to me please? Is the 'former dataset' the unadjusted and the 'current dataset' the adjusted meaning that broadly speaking all temperatures (old and new) have been adjusted up the way? I note both are trending up the way although the 'former' one by less and not much at all really (about a degree over a century).http://www.ncdc.noaa.gov/temp-and-precip/divisiona...
On a more general note if this is to be a useful debate we really do need to hear from both sides so let's not be hounding anybody out even if we disagree

durbster said:
But all the data is available for you to see - there's a tool here that allows you to see the adjustments for yourself:
http://www.ncdc.noaa.gov/temp-and-precip/divisiona...
That does nothing at all to make your case. Many of us don't need to see the adjustments again, we know it's done in plain view and we've seen it before.http://www.ncdc.noaa.gov/temp-and-precip/divisiona...
It also hides the prior problems of data corrupted by LULC/UHIE, of substitution, and of omission.
The issue on top of all that is why the adjustments are made the way they are, such that - as per a previous discussion on adjustments - they are made with the exception of one part of one previous decade such that historical temperatures are reduced and more recent temperatures increased which produces a warming trend from flat or cooling raw data.
Saying 'here is the corrupted data which has also been adjusted' is simply doing nothing at all in effect.
DibblyDobbler said:
durbster said:
But all the data is available for you to see - there's a tool here that allows you to see the adjustments for yourself:
http://www.ncdc.noaa.gov/temp-and-precip/divisiona...
Durbster - I'm interested in this, can you (or anybody else for that matter) explain the graph to me please? Is the 'former dataset' the unadjusted and the 'current dataset' the adjusted meaning that broadly speaking all temperatures (old and new) have been adjusted up the way? I note both are trending up the way although the 'former' one by less and not much at all really (about a degree over a century).http://www.ncdc.noaa.gov/temp-and-precip/divisiona...
On a more general note if this is to be a useful debate we really do need to hear from both sides so let's not be hounding anybody out even if we disagree
https://www.ncdc.noaa.gov/monitoring-references/fa...
Lotus 50 said:
That does look to be the case in the dataset you've picked - it's not necessarily the case with all of the datasets you can access via that link. Despite what some here would have you believe (along with the blogs that get repeatedly referenced suggest) the adjustments are well documented and subject to checks e.g. the summary page here:
https://www.ncdc.noaa.gov/monitoring-references/fa...
The corrupted and then adjusted data in near-surface datasets has diverged markedly from UAH and RSS satellite data and there is no physical reason why this should be so. Despite transparent attempts to portray the satellite data as less reliable when the sampling and accuracy are both superior, this demonstrates the problems with near-surface data which are not fit for purpose. Getting people to read what the database managers say is hardly independent verification of anything, in fact it's pointless.https://www.ncdc.noaa.gov/monitoring-references/fa...
turbobloke said:
The corrupted and then adjusted data in near-surface datasets has diverged markedly from UAH and RSS satellite data and there is no physical reason why this should be so. Despite transparent attempts to portray the satellite data as less reliable when the sampling and accuracy are both superior, this demonstrates the problems with near-surface data which are not fit for purpose. Getting people to read what the database managers say is hardly independent verification of anything, in fact it's pointless.
The link I provided also provides further links to the scientific publications setting out the processes for review/verification.Lotus 50 said:
turbobloke said:
The corrupted and then adjusted data in near-surface datasets has diverged markedly from UAH and RSS satellite data and there is no physical reason why this should be so. Despite transparent attempts to portray the satellite data as less reliable when the sampling and accuracy are both superior, this demonstrates the problems with near-surface data which are not fit for purpose. Getting people to read what the database managers say is hardly independent verification of anything, in fact it's pointless.
The link I provided also provides further links to the scientific publications setting out the processes for review/verification.Next thing you'll be telling us it was a wizard wheeze to adjust Sea Surface Temperature upwards by realigning more accurate buoy data with less accurate and heat-corrupted ship intake temperatures.
The growing divergence and lack of any physical basis for it is all that needs addressing and nothing you or durbster have linked to goes anywhere near to explaining it.
RSS
The slope is flat since December, 1996 or 18 years, 5 months. (goes to April)
For RSS: There is no statistically significant warming since January 1993: Cl from -0.023 to 1.682.
The RSS average anomaly for 1998 was the warmest at 0.55. The highest ever monthly anomaly was in April of 1998 when it reached 0.857. The anomaly in 2014 was 0.255 and it was ranked 6th.
UAH6.0
The slope is flat since January 1997 or 18 years and 4 months.
For UAH: There is no statistically significant warming since October 1992: Cl from -0.042 to 1.759
The highest ever monthly anomaly was in April of 1998 when it reached 0.742. The anomaly in 2014 was 0.170 ranked 6th.
Hadcrut4.3
The slope is not flat for any period worth mentioning.
For Hadcrut4: There is no statistically significant warming since June 2000: Cl from -0.015 to 1.387.
The highest ever monthly anomaly was in January of 2007 when it reached 0.835. The anomaly in 2014 was 0.564 and this set a new record at the time.
Hadsst3
The slope is not flat for any period worth mentioning.
There is no statistically significant warming since June 1995: Cl from -0.013 to 1.706.
The highest ever monthly anomaly was in August of 2014 when it reached 0.644. The anomaly in 2014 was 0.479 and this set a new record.
GISS
The slope is not flat for any period worth mentioning.
There is no statistically significant warming since November 2000: Cl from -0.041 to 1.354.
The highest ever monthly anomaly was in January of 2007 when it reached 0.93. The anomaly in 2014 was 0.68 and it set a new record.
Why are the satellite and near-surface datasets significantly different and diverging? There is no physical basis.The reason is that corrupted near-surface data, which is then substituted and adjusted until it's red (hot) in the face, is no longer reflecting reality.And the biggest fail of all is that even with LULC/GDP/UHIE corruptions, the substitution due to unsatisfactory sampling, and after all the adjustments creating warming trends from flat or cooling data, there's still no visible causal human signal in any global climate data.
For UAH v6.0 data see:
http://vortex.nsstc.uah.edu/data/msu/v6.0beta/tlt/...
also www.drroyspencer.com/wp-content/uploads/Version-61...
For RSS, see: ftp://ftp.ssmi.com/msu/monthly_time_series/rss_monthly_msu_amsu_channel_tlt_anomalies_land_and_ocean_v03_3.txt
For Hadcrut4, see: http://www.metoffice.gov.uk/hadobs/hadcrut4/data/c...
For Hadsst3, see: http://www.cru.uea.ac.uk/cru/data/temperature/HadS...
For GISS, see:
http://data.giss.nasa.gov/gistemp/tabledata_v3/GLB...
Links worked at the time of filing in 2015.
Representative error bar info: satellite +/- 0.04 deg C, near-surface +/- 0.07 deg C i.e. nearly twice the satellite error.
durbster said:
Oh come on. If you really think there are no credible sources you simply can't have an opinion. Unless you're doing the experiments yourself, you are getting your information from someone.
You can't question everything. It's impractical. If you really want to learn something firsthand you have to study it, otherwise you have to find out from somebody else. You might be content getting your science from a car forum or a blog written by a journalist or author, whereas others might be happier with science literature.
either study it or physically experience over a large period of time. the history of fish recruitment in the north east atlantic is all you really need to read to understand the natural expansion and contraction (warming and cooling) of the temperate zone over time. the cooling period was deemed to be a coming ice age by some scientists , the warming phase that appears to be ending is the global warming scare. hopefully once we have gone full cycle the alarmists, grant sucking leeches and associated crack pots, ecomentalists and others of a hyperbolic persuasion will shut the fYou can't question everything. It's impractical. If you really want to learn something firsthand you have to study it, otherwise you have to find out from somebody else. You might be content getting your science from a car forum or a blog written by a journalist or author, whereas others might be happier with science literature.
k up once and for all, give us all peace and let scientists get back to doing science the boring way.that way it will attract less of the attention seeking sort hell bent on big look at me proclamations.
if not the developed western world can look forward to disappearing up its own arse while the rest of the developing world pisses itself laughing at us,and justifiably so.
durbster said:
If the Met, NASA and the NOAA really were being fraudulent or nefarious, don't you think they'd be a little more discreet about it?
Good lord no. As they learned from the email release problems it's much more effective to be doing such stuff in plain sight complete with managed press releases. After all, nobody commits blatant fraud in the full glare of publicity do they? Well, except politicians of course.
And quite a few scientists, mainly working in medicine, in recent times come to think of it although those who were outed tended to be working more or less alone rather than in a self selecting and self supporting group.
Moreover none of the others, so far as I recall, were suggesting that a major source of the problem, in their view, just happened to be related to materials (carbon based products) that can be readily accounted for at the point of production and use, are widely used and relied upon and therefore make excellent targets for extending the taxation regimes that have long been applied to them as government cash cows.
Were the reported problems connected to something else that was not such a consumable item and therefore barely taxable (say clouds or some effect of the workings of the sun or perhaps some other yet to be recognised phenomenon that could not be bottled and taxed) I very much doubt that the politicians would care about the odd 0.05 degree increase in alleged global temperature even if the proof was conclusive.
Of course that would not stop them touting for taxes but it would at least be likely to make them come up with more creative suggestions and so provide us with greater entertainment.
anonymous said:
[redacted]
What on Earth was the point of posting that?! Santer of IPCC fame telling us they don't deal with solar eruptivity forcing even though it's more important than irradiance (hang on, no, that escaped his memory) and that the space left behind can be conveniently but unsatisfactorily plugged with carbon dioxide's assumed potence - not seen in the data without bodge after bodge after bodge, copyright UEA CRU - in order to create a model that doesn't represent reality? 'The amount of warming we see' ho ho ho none for nearly 19 years when the SST buoy-to-ship-intake fudge is ignored. Santer's contrived rhetoric with as much hidden as exposed takes his readers nowhere. He also has the breassneck to claim political rhetoric from others, with irony off the scale yet again.
Gassing Station | News, Politics & Economics | Top of Page | What's New | My Stuff