Stock market is a "fully-fledged epic bubble" and will burst
Discussion


vulture1 said:
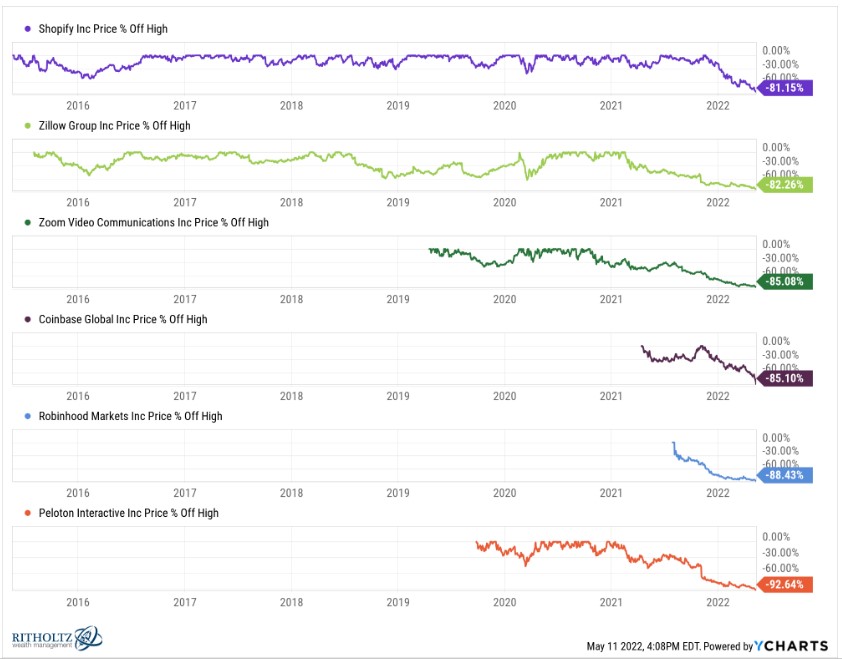
Buy the dip!!! lol... Nah some of those non profit crazy tech growth and covid plays will never recover. 1 or two might make it but who can tell.
Nip over to Seeking Alpha and one will find 20 or more pundits who've staked all on these Tech stocks. Peloton will be $120 this time next year Rodney!DaveA8 said:
vulture1 said:
Buy the dip!!! lol... Nah some of those non profit crazy tech growth and covid plays will never recover. 1 or two might make it but who can tell.
Nip over to Seeking Alpha and one will find 20 or more pundits who've staked all on these Tech stocks. Peloton will be $120 this time next year Rodney!Fascinating stuff.
You appear to be indicating the following.
One generation ago investors (gamblers) went mad buying hot shot tech stocks.
It did not end well and subsequently became known as the Dot Com bubble. Many 'burnt fingers'.
Now a new generation, who presumably might not know anything about the lesson of 1999, are hoping they can get rich quick.
Just hope they are using money they do not need.
Don't tell me, some have borrowed heavily, because they want their profits to be magnified.
I saw a news item earlier today about someone who took a mortgage to buy Cryptocurrency !! Think the article said the price fell 98% overnight. He now expects his home to be in a shop doorway.
All very sad.
Edited by Jon39 on Thursday 12th May 20:53
Mr Whippy said:
b hstewie said:
hstewie said: What bubble 
This is what puts me off global trackery type stuff.Investing in piles of utter rubbish that needs to be “timed” to work out, but which you can’t time because it’s wrapped up.
bmwmike said:
Mr Whippy said:
bhstewie said:
hstewie said: What bubble
This is what puts me off global trackery type stuff.Investing in piles of utter rubbish that needs to be “timed” to work out, but which you can’t time because it’s wrapped up.
Mr Whippy said:
bhstewie said:
hstewie said: What bubble
This is what puts me off global trackery type stuff.Investing in piles of utter rubbish that needs to be “timed” to work out, but which you can’t time because it’s wrapped up.
Derek beat me to it (and I don't work in the financial industry) but the stocks in the chart are inconsequential to a world index.
DaveA8 said:
vulture1 said:
Buy the dip!!! lol... Nah some of those non profit crazy tech growth and covid plays will never recover. 1 or two might make it but who can tell.
Nip over to Seeking Alpha and one will find 20 or more pundits who've staked all on these Tech stocks. Peloton will be $120 market cap this time next year Rodney!
bhstewie said:
hstewie said:Mr Whippy said:
bhstewie said:
hstewie said: What bubble
This is what puts me off global trackery type stuff.Investing in piles of utter rubbish that needs to be “timed” to work out, but which you can’t time because it’s wrapped up.
Derek beat me to it (and I don't work in the financial industry) but the stocks in the chart are inconsequential to a world index.
Probably thousands if you take the time to look globally.
If you can’t ‘get it’ in 2 mins then it’s probably rubbish.
Yes yes one in a hundred might become Amazon… sad to miss out on it. Oh well.
Then all the ethically horrible stuff, like Roblox and gambling stuff. Yes you can make a great return, but I like to sleep at night too.
Wow look, if I buy this global tracker I’m giving money to people who make guns to shoot people dead too. Again, not great.
A global tracker with a customisable blacklist would be lovely.
Derek Chevalier said:
bmwmike said:
Mr Whippy said:
bhstewie said:
hstewie said: What bubble
This is what puts me off global trackery type stuff.Investing in piles of utter rubbish that needs to be “timed” to work out, but which you can’t time because it’s wrapped up.
bhstewie said:
hstewie said: But if you buy a global world tracker you're really not going to be holding that much that's outside of the S&P 500 so far as US super tech.
Haven't looked but I'd be surprised if Peloton and companies like that even figure there.
I’ll be honest I’ve not looked at constituents etc.Haven't looked but I'd be surprised if Peloton and companies like that even figure there.
I assume global trackers hold a bit of everything? Or is it just S&P500, FTSE100, Nifty50 and all the big per-country indexes?
If so then that does protect you a bit from rubbish… but then probably not as diversified as one would think (ie, lots of weight in top end of S&P500)
Mr Whippy said:
Exactly it’s not like those 6 stocks are it.
There are loads of them.
Pretty much every IPO from the last 18 months can go on there. Day-dreamy bks bought up because ‘hype’
Yeah it feels like every stock launches at the "this could be it potential value" price straight away nowadays. Then we are surprised when it crashes to its actual value or less.There are loads of them.
Pretty much every IPO from the last 18 months can go on there. Day-dreamy b
ks bought up because ‘hype’Mr Whippy said:
I’ll be honest I’ve not looked at constituents etc.
I assume global trackers hold a bit of everything? Or is it just S&P500, FTSE100, Nifty50 and all the big per-country indexes?
If so then that does protect you a bit from rubbish… but then probably not as diversified as one would think (ie, lots of weight in top end of S&P500)
You can download the constituents of most indexes.I assume global trackers hold a bit of everything? Or is it just S&P500, FTSE100, Nifty50 and all the big per-country indexes?
If so then that does protect you a bit from rubbish… but then probably not as diversified as one would think (ie, lots of weight in top end of S&P500)
This is an MSCI World Index tracker for example.
https://www.ssga.com/uk/en_gb/institutional/etfs/f...
Peloton and the other stocks on the screenshot will make you poor if you're invested in them but you'll have next to no exposure via broad global indexes.
Derek Chevalier said:
I think you may have linked to this Youtube channel before - this one is worth a watch.
https://www.youtube.com/watch?v=jjWmaRKmnEA
Thanks. As he hints at the end of the vid - for the amateur investor like myself it's probably best to avoid Factor investing and stick to simple global index investing, unless you know what you're doing. Probably more risk than reward in my casehttps://www.youtube.com/watch?v=jjWmaRKmnEA
Latest Vanguard article - https://www.vanguardinvestor.co.uk/articles/latest...
Mr Whippy said:
It’s not just those is it though. There are hundreds.
Probably thousands if you take the time to look globally.
If you can’t ‘get it’ in 2 mins then it’s probably rubbish.
Yes yes one in a hundred might become Amazon… sad to miss out on it. Oh well.
Then all the ethically horrible stuff, like Roblox and gambling stuff. Yes you can make a great return, but I like to sleep at night too.
Wow look, if I buy this global tracker I’m giving money to people who make guns to shoot people dead too. Again, not great.
A global tracker with a customisable blacklist would be lovely.
"There are hundreds" - If you knew these obvious over valued companies, did you short them? If so, you would have made a killing. Probably thousands if you take the time to look globally.
If you can’t ‘get it’ in 2 mins then it’s probably rubbish.
Yes yes one in a hundred might become Amazon… sad to miss out on it. Oh well.
Then all the ethically horrible stuff, like Roblox and gambling stuff. Yes you can make a great return, but I like to sleep at night too.
Wow look, if I buy this global tracker I’m giving money to people who make guns to shoot people dead too. Again, not great.
A global tracker with a customisable blacklist would be lovely.
Also, why do you need a global tracker with a customisable blacklist if you already know the (above) over valued companies i.e. due to your ability to discount the overvalued companies, I assume you trust your ability to buy the best performing individual stocks, right?
chip* said:
"There are hundreds" - If you knew these obvious over valued companies, did you short them? If so, you would have made a killing.
It's one thing to spot the obviously overvalued st - especially the fraudy pumps - it's another thing entirely to safely short it. "The market can stay irrational longer than you can stay solvent."
Gassing Station | Finance | Top of Page | What's New | My Stuff